POCUS Spotlight: Perioperative Hemodynamic Assessment in Noncardiac Surgery
Cite as: Peck M, Wilkinson J, Miller A. POCUS spotlight: perioperative hemodynamic assessment in noncardiac surgery. ASRA Pain Medicine News 2022;47. https://doi.org/10.52211/asra110122.048
Many aspects of routine perioperative care can affect even healthy patients’ hemodynamic profiles. Mechanical ventilation, positioning, surgical access, blood loss, and vasoplegia all interplay dynamically and may cause low blood pressure and hypoperfusion. Add in preexisting cardiovascular disease, and you have the perfect storm.
In noncardiac operating rooms and general intensive care units, treatment is limited to manipulating intravascular volume, vasomotor tone, and ventricular performance. However, those strategies have several challenges, such as determining which of these is most important for the individual patient, how much they need, and when. This is partly due to non-specific physical examination findings and the availability of suitable diagnostic and monitoring technology. While heart-lung interactions can be used to predict whether a patient is "preload-responsive," they are not always useful in practice.1 Consequently, providers tend to apply simplistic, empirical, nonindividualized therapy.
Venous congestion has been a POCUS growth area in recent years.
The key to managing patients with circulatory failure is to identify the etiology. Fortunately, point-of-care ultrasound (POCUS) provides us with unparalleled insight into a patient’s contributing anatomy and physiology.2
Hemodynamic assessment can seem complex in the presence of multiple interdependent components; however, it can be simplified by following a few basic principles related to flow, pressure, and volume.
Flow
Blood flow is key to organ perfusion. Identifying and correcting low cardiac output takes primacy; however, it is difficult, even for experts, to determine it clinically. Therefore, it must be measured.3
The velocity-time integral (VTI) recorded from the left ventricular outflow tract (LVOT) using pulsed-wave (PW) Doppler represents the distance travelled by blood leaving the left ventricle during systole. Stroke volume (SV) is the product of the LVOT VTI and LVOT area, which is difficult to measure accurately because its diameter is small and any error in caliper placement is squared in the calculation. Fortunately, LVOT VTI and minute-distance (LVOT VTI x heart rate) are useful surrogates for trends in SV and cardiac output (CO), respectively. See Figure 1. SV and CO trends indicate whether the patient is responding to therapy.
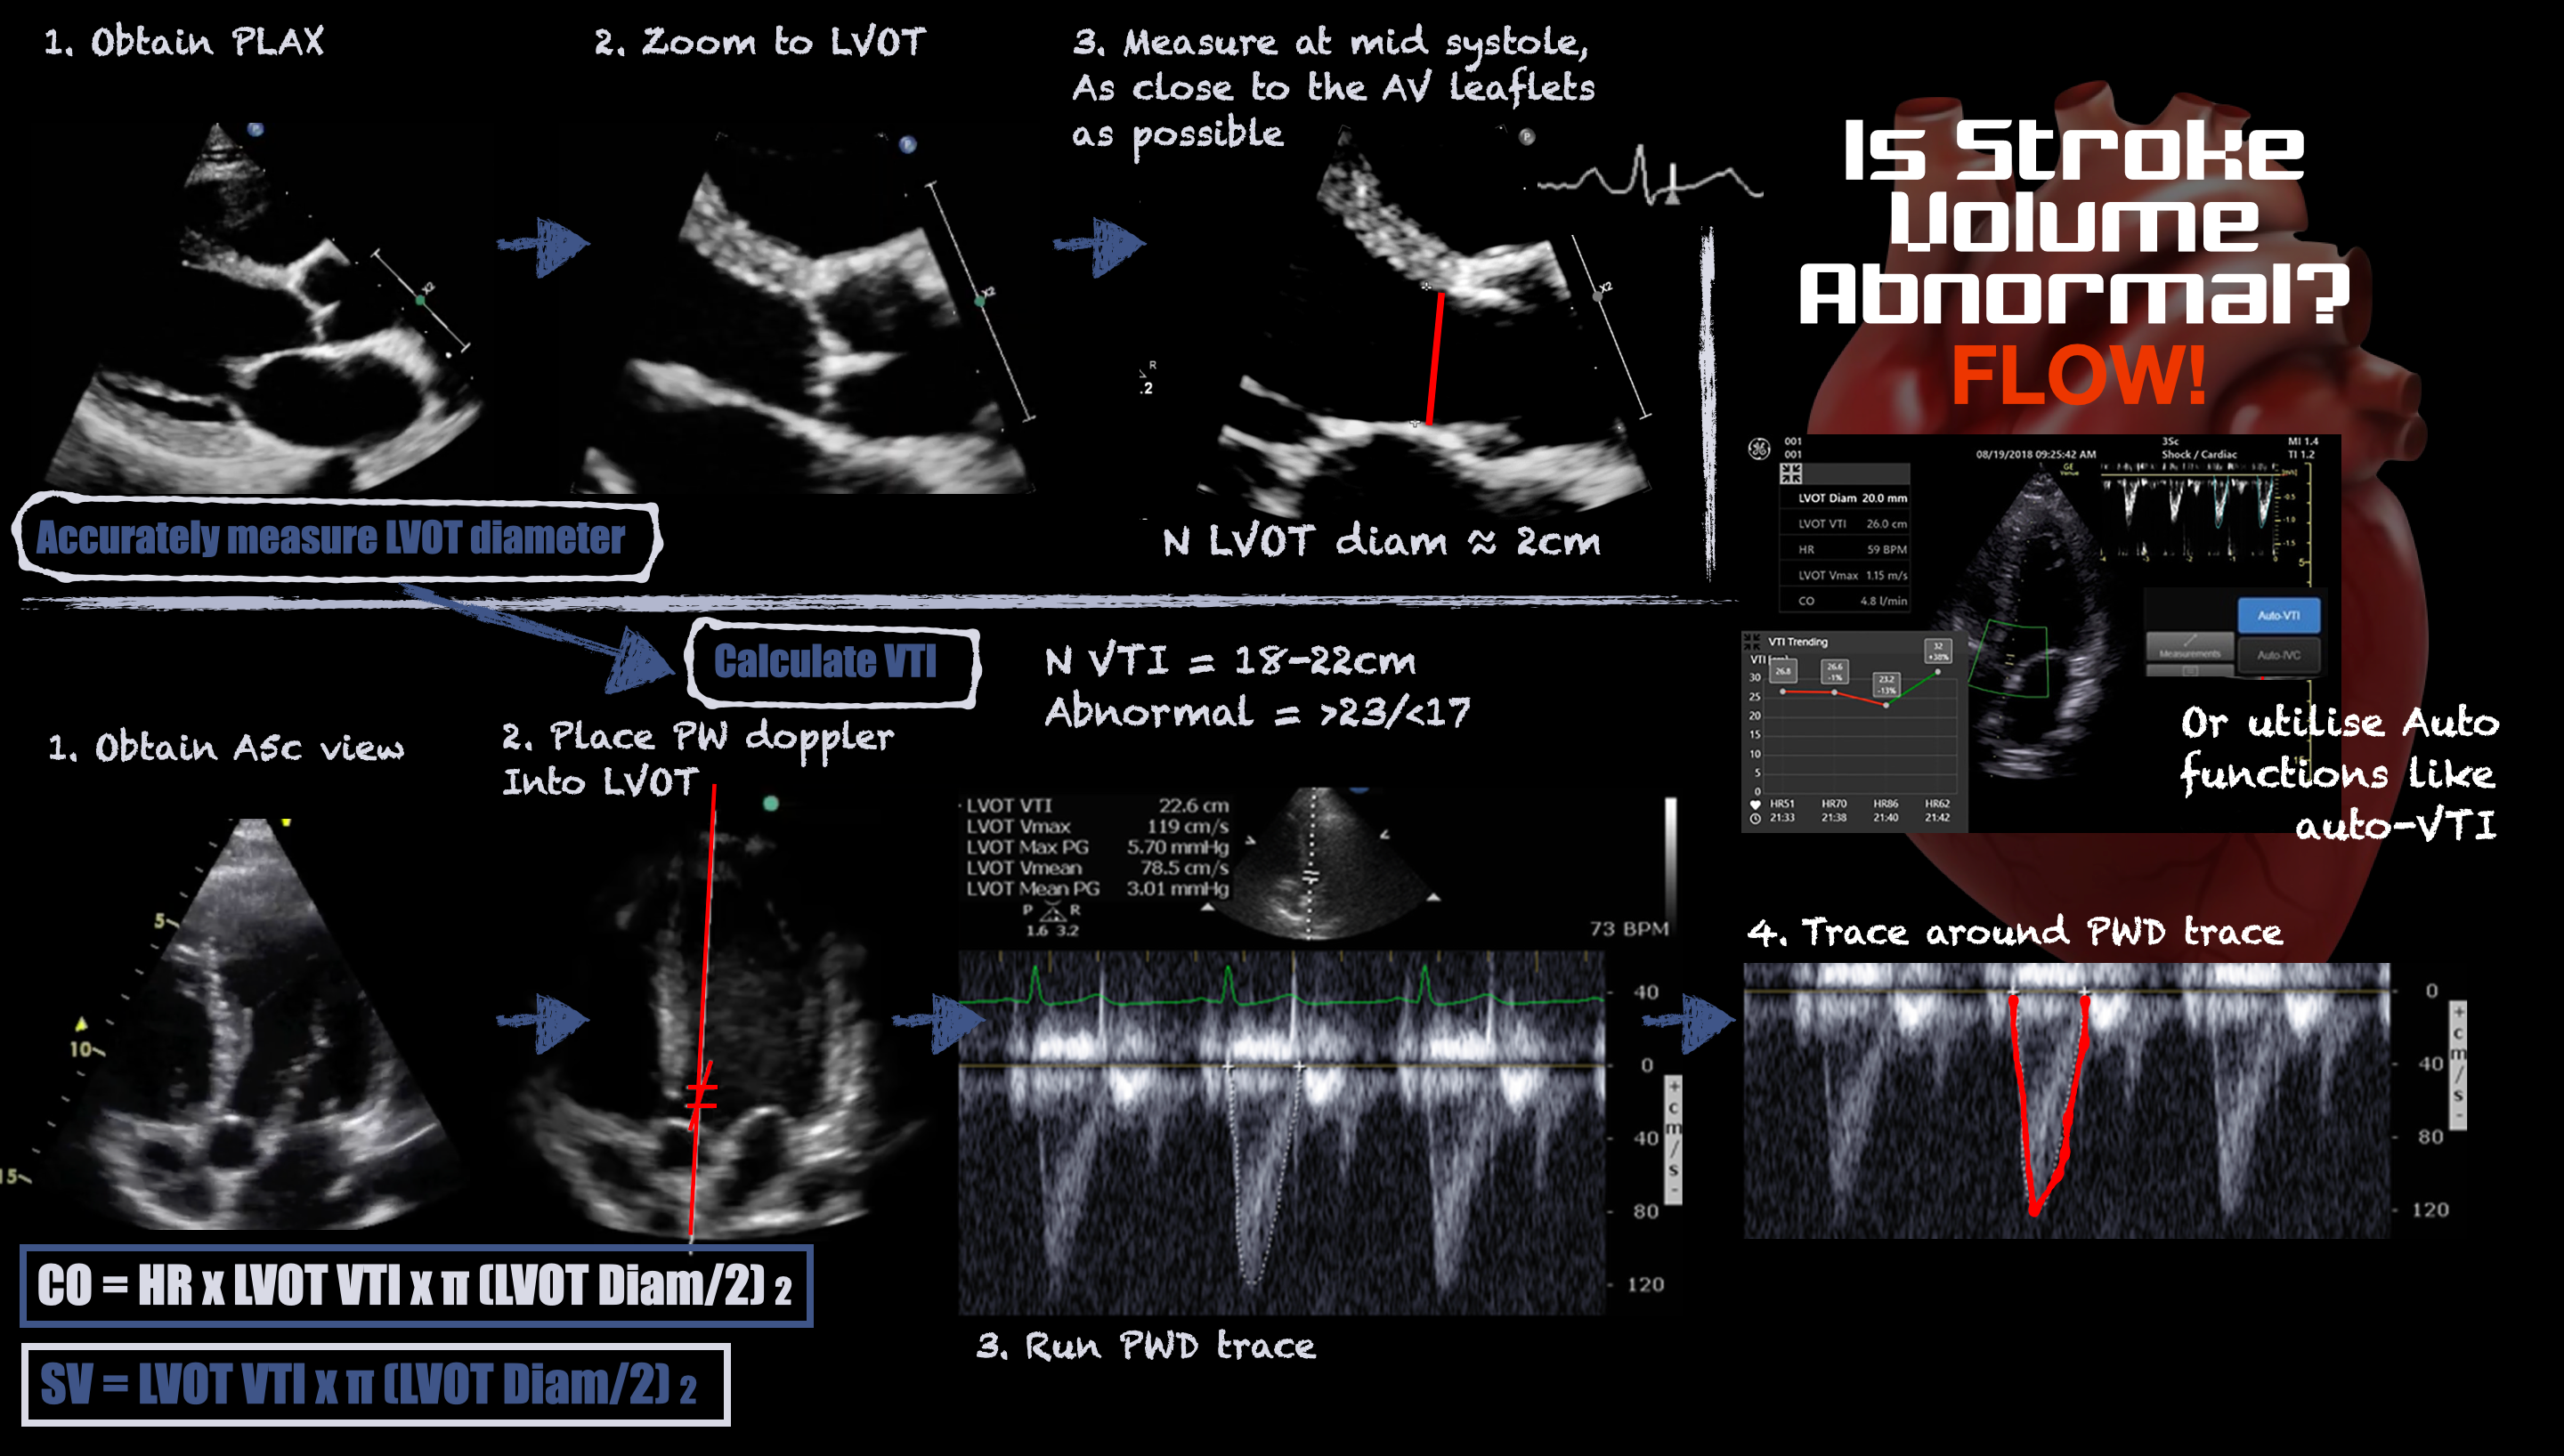
Figure 1. Infographic demonstrating how to measure stroke volume using ultrasound
Historically, the term responsiveness has been used in context of volume expansion. However, vasopressor and inotrope responsiveness are equally important in the operating room. For instance, vasopressors may increase or decrease CO depending on whether they predominantly affect the venous system (increasing preload) or the arterial system (increasing afterload), respectively. See Figure 2.
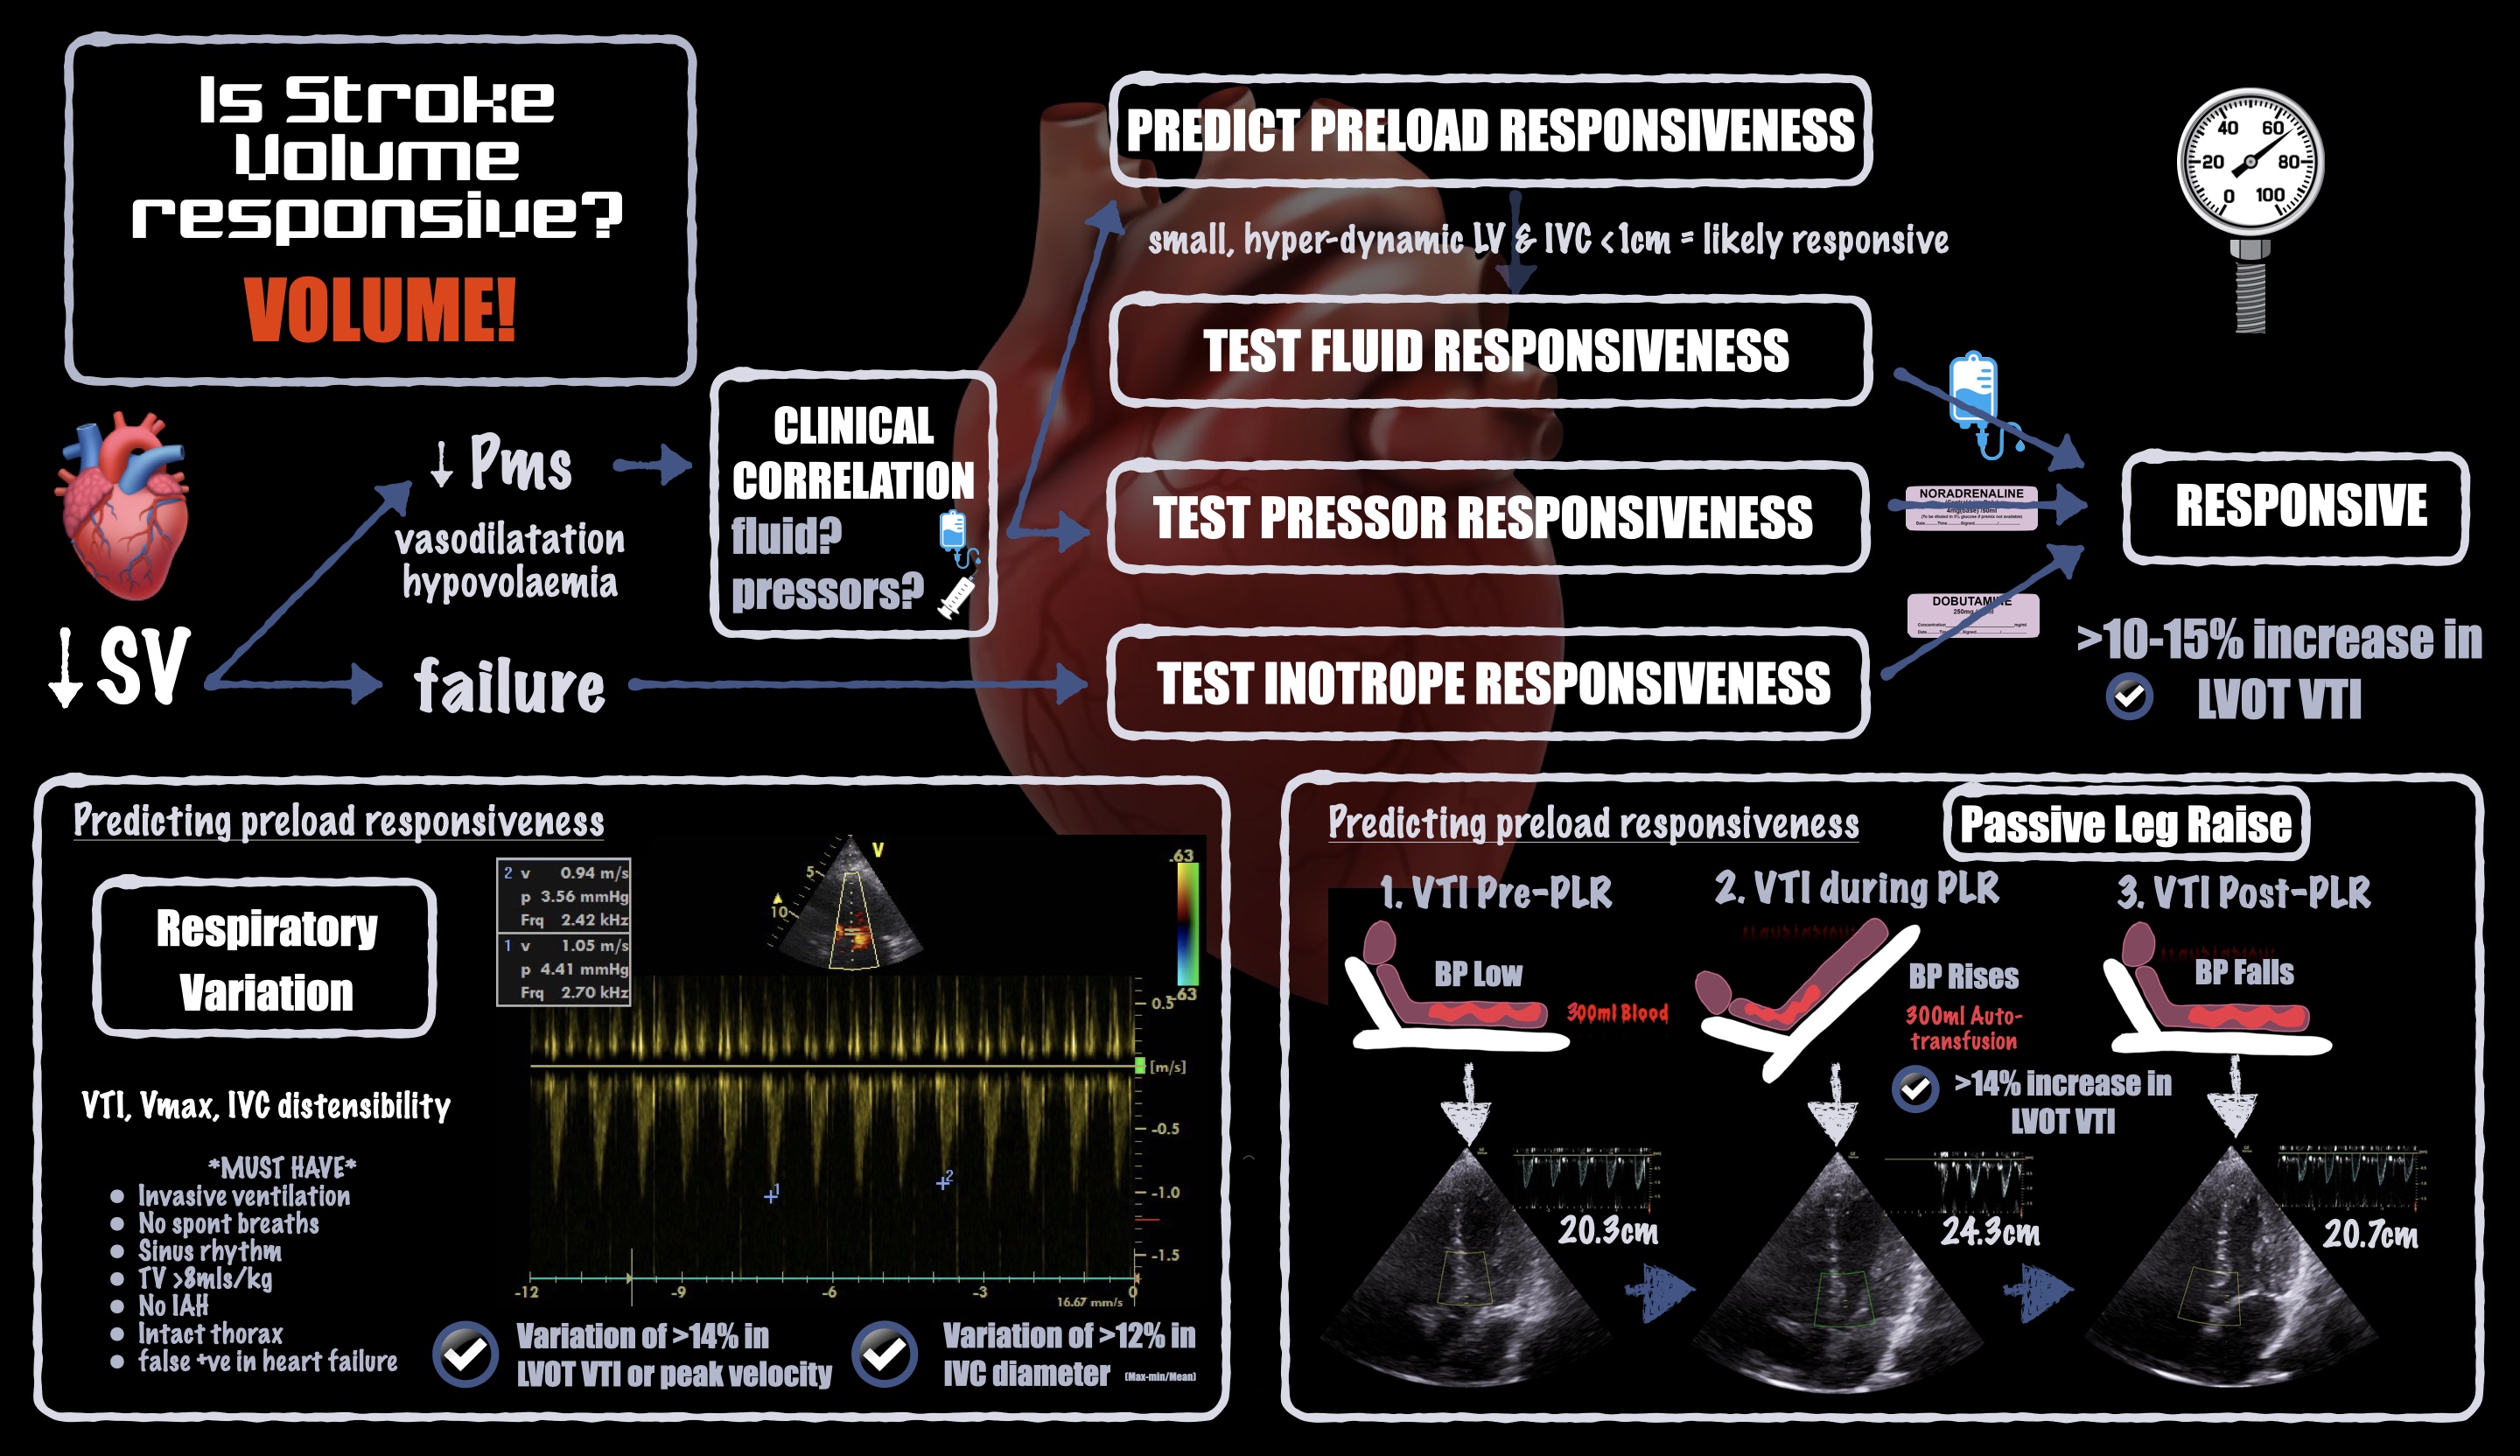
Figure 2. Infographic demonstrating how to estimate or measure stroke volume responsiveness
Pressure
Blood flows along pressure gradients between the cardiac chambers and the circulation system’s venous and arterial components. Obstruction at any point can lead to upstream congestion and downstream shock. Therefore, it is important to know where abnormal pressures exist in a hemodynamically unstable patient.
Gross valvular disease is a key POCUS finding. Identifying the type and extent of valvular disease can help the anesthesiologist manage the patient’s physiology. Thickened, immobile valves are readily identifiable with two-dimensional ultrasound; the addition of color Doppler can highlight regurgitant valves. Chronic valvular disease is often clinically quiescent because of adaptive changes, so perioperative scanning may be the first time it gets recognized. When a patient with left ventricular (LV) hypertrophy is exposed to hypovolemia or vasoplegia with sympathetic stimulation, high-velocity blood can cause sufficiently low pressure in the LVOT that the anterior mitral valve leaflet is drawn toward the septum, causing dynamic LVOT obstruction. This so-called systolic anterior motion ("SAM") of the mitral valve leaflet is readily visible with POCUS and may explain why we sometimes see highly variable intra-operative blood pressures in patients with LV hypertrophy.
Ventricular dilatation and systolic failure are easy to identify with POCUS. However, symptoms and signs of heart failure, such as pulmonary and peripheral edema, are caused by diastolic failure, which is not always obvious when it exists in isolation. Another diagnostic challenge is that LV ejection fraction is load dependent, meaning that visual assessment of systolic function may be overestimated in the hypovolemic or vasoplegic states commonly seen in perioperative care (ie, what looks normal may not in fact be normal). One solution is to look instead for signs of raised left atrial (LA) pressure.
Widespread B lines on lung ultrasound plus fixed atrial septal bowing toward the right atrium are clear two-dimensional signs of raised LA pressure. Tissue Doppler imaging (TDI) uses PW Doppler and a low-pass filter to evaluate slow tissue movement. TDI recorded on either side of the mitral annulus indicates the rate of LV shortening (S') and lengthening (e'), and informs systolic and diastolic function, respectively. The fraction of early mitral filling (E) and e' velocities (known as E/e') greater than 14 (averaged) indicates raised LA pressure. Other markers include E/A of more than 2, LA enlargement, and tricuspid regurgitation peak velocity (TR Vmax) of more than 2.8 m/s.4 The more of these indicators present, the more likely the patient has raised LA pressure.
Right ventricular (RV) failure causes false positive results when observing stroke-volume variation (SVV) to predict volume responsiveness. Fortunately, RV failure is easy to diagnose with POCUS; hence it should be part of the investigation of any hemodynamically unstable patient. Raised pulmonary arterial (PA) pressure can cause right heart failure and provoke overt shock in the context of mechanical ventilation and IV fluid loading. Therefore, it is important to preoperatively identify raised PA pressure.
To identify a patient with raised PA pressure, with or without RV dilatation, evaluating peak velocity of the tricuspid regurgitation jet (TR Vmax) is necessary. Color Doppler can be used to identify tricuspid regurgitation, which is present in around 70% of the population.5 PW Doppler can be used to measure TR Vmax. TR Vmax less than 2.8 m/s is normal; measurements higher than 3.4 m/s suggest a high probability of pulmonary hypertension.6
Volume
Both low and high intravascular volume cause shock. Historically, focus has been on liberal fluid resuscitation until clinical response stops. That practice is changing in favor of more restrictive strategies to prevent venous congestion, which can also cause hypoperfusion and organ failure.7
To assess preload with POCUS, we can observe cardiac chamber sizes, inferior vena cava diameter, and volume responsiveness (measured after a fluid challenge; predicted after a passive leg raise).8 Of those, volume responsiveness is the most sensitive and specific: It indicates high volume tolerance, meaning that fluid loading may be beneficial and is unlikely to cause acute harm. Volume responsiveness is a normal physiologic state and does not necessarily signal a need for volume expansion.
If a volume-intolerant state is identified, discontinue fluid therapy and consider fluid removal because the patient may be in a state of venous congestion. Intraoperative diuresis is rare for several reasons: fluid overload states are underdiagnosed, accurately measuring fluid balance is challenging, and we do not usually monitor stroke volume intraoperatively. POCUS can be a useful tool to identify and monitor venous congestion. See Figure 3.
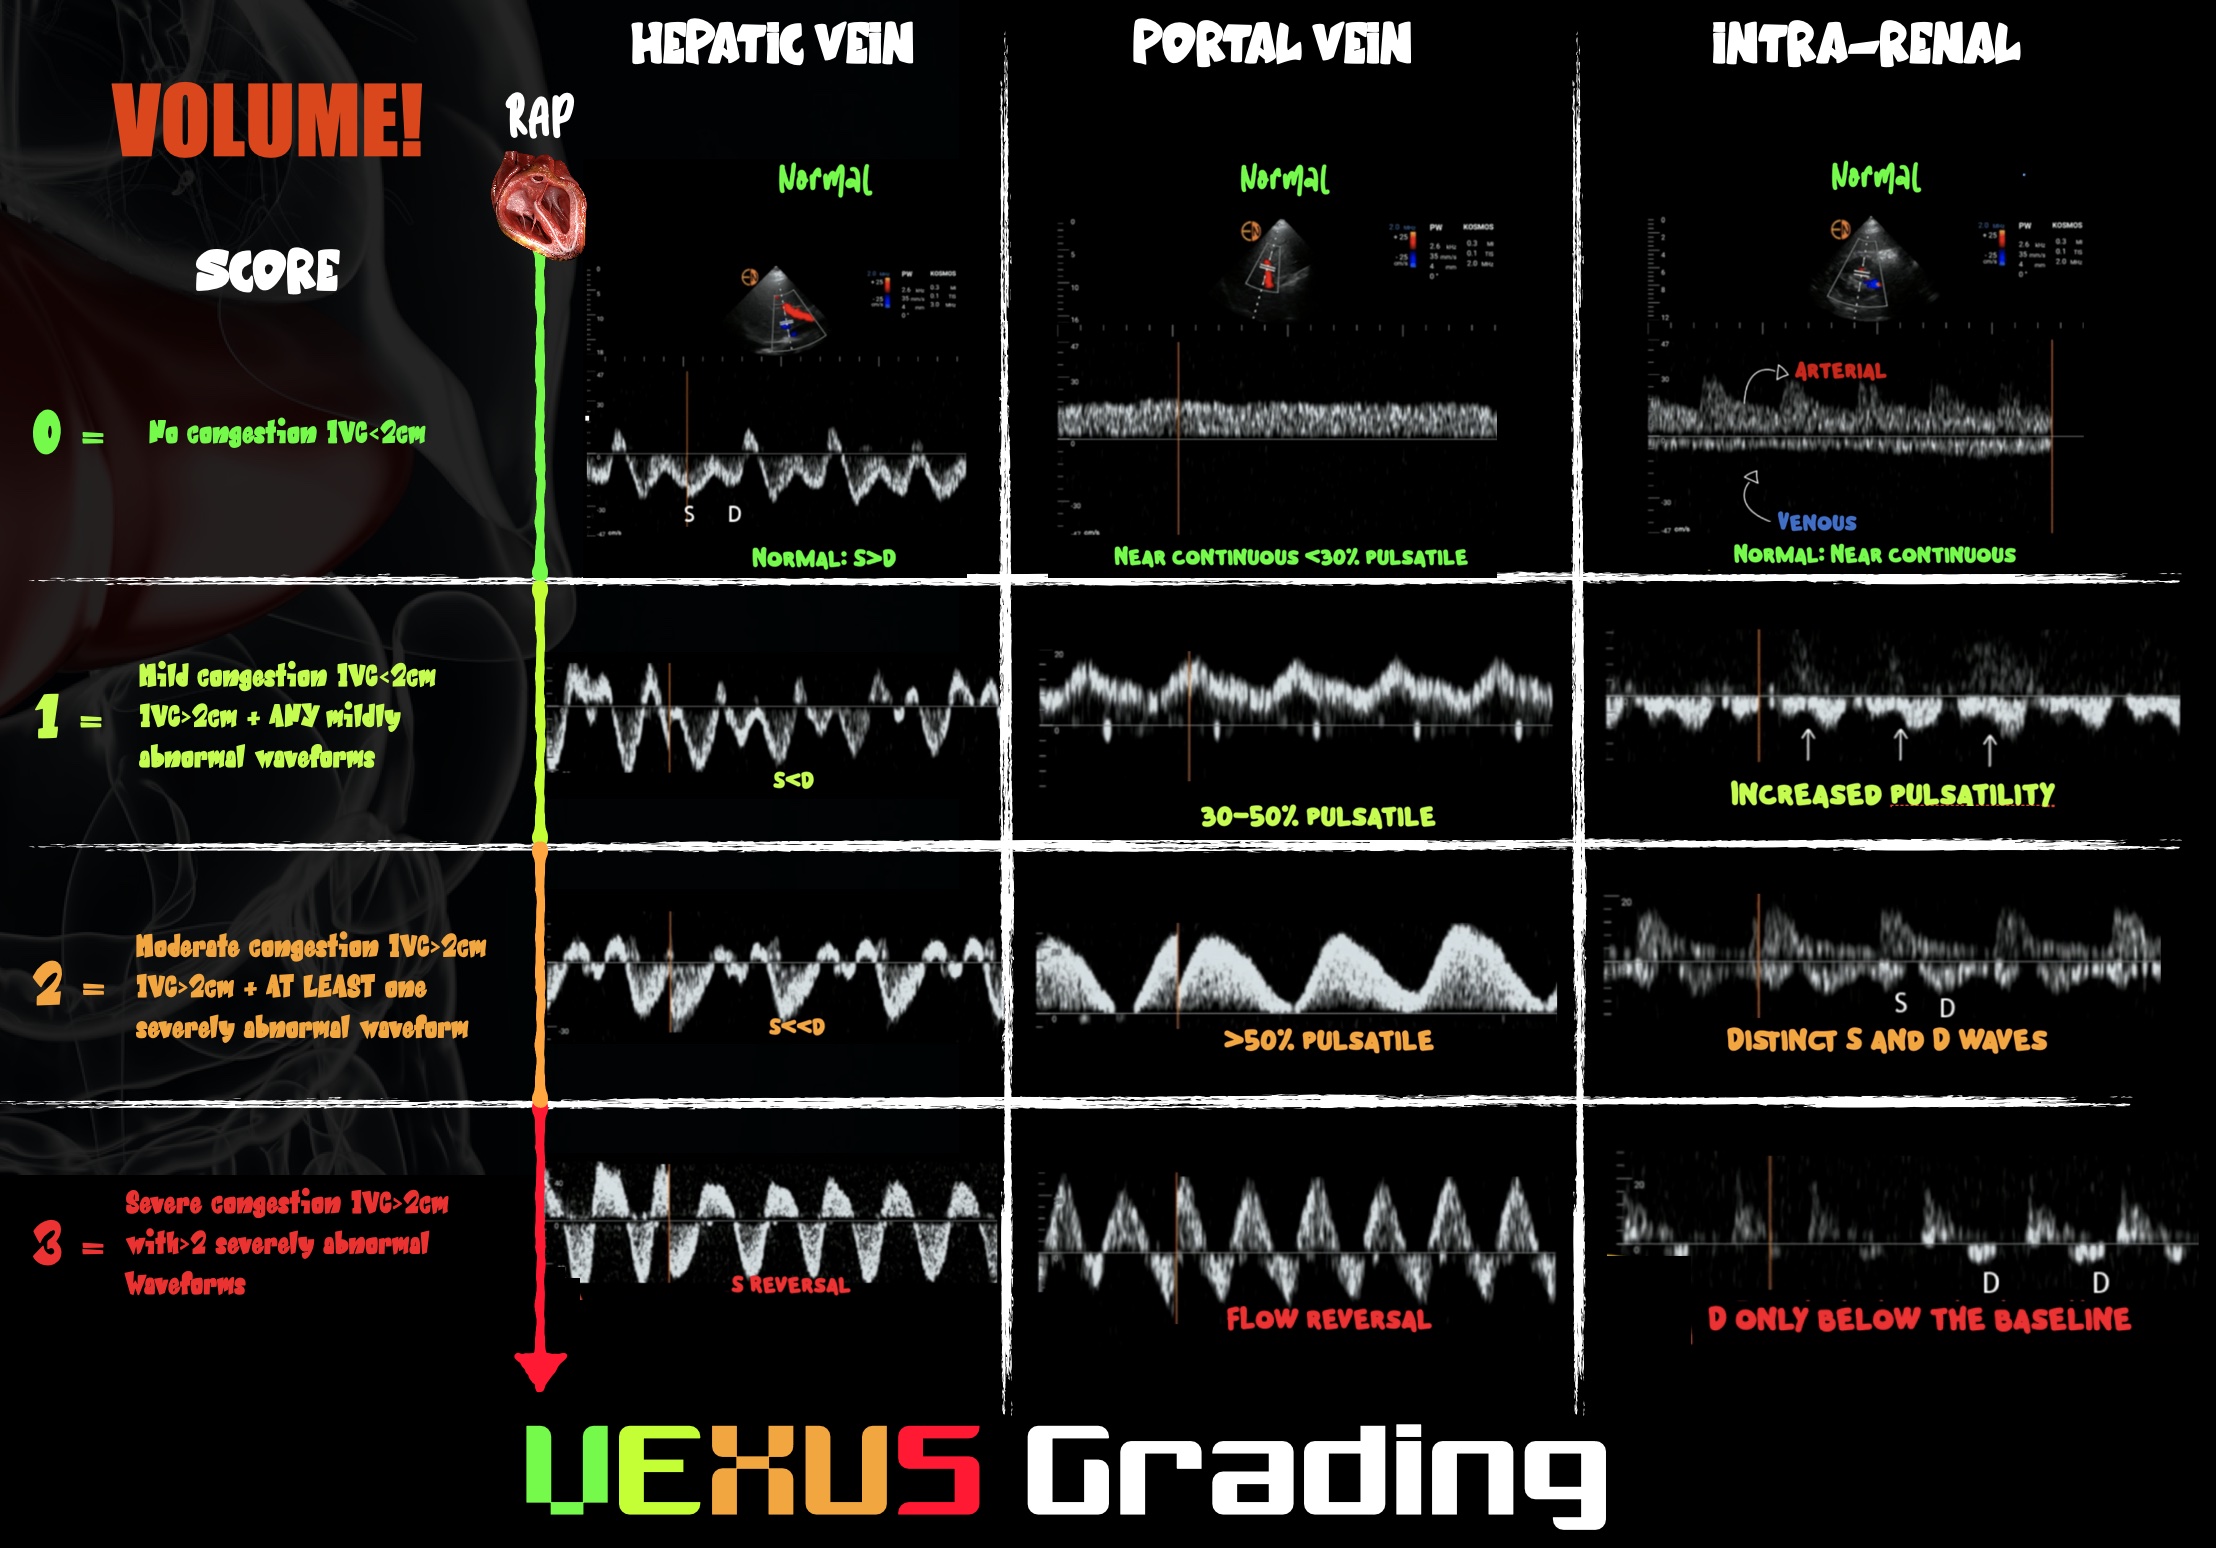
Figure 3. Infographic demonstrating VExUS grading
Venous congestion has become a POCUS growth area in recent years. On PW Doppler, the hepatic portal veins of a healthy, euvolemic patient have near-continuous flow patterns with minimal pulsatility. As venous congestion increases, the vessels become increasingly pulsatile. The hepatic veins develop an increasingly biphasic systolic S wave and diastolic D wave that correlate with exaggerated x and y descents of the central venous pressure trace, respectively. In severe venous congestion, the S wave becomes reversed, leaving a monophasic D wave. The renal vessels can also be interrogated and demonstrate congestion when the venous phase becomes monophasic and the resistive index rises above 0.6. The culmination of changes demonstrated in those three vessels gives the so-called VExUS score of 0–3, where 3 predicts the development of acute kidney injury.
Transthoracic echocardiograms or abdominal windows can be challenging to obtain intraoperatively and are best done in the pre- and postoperative periods. Transesophageal echocardiography has advantages over transthoracic in the noncardiac, intraoperative setting and is the subject of rapid POCUS development.
Conclusion
Some of the POCUS techniques aforementioned for hemodynamic assessment are advanced techniques that require appropriate teaching and frequent supervised practice. Nonetheless, once proficient, these skills are useful in the diagnosis and management of patients with perioperative circulatory failure - often difficult tasks based on clinical assessment alone.

Marcus Peck, MD, (@ICUltrasonica) is a consultant in anesthesia and intensive care medicine at Frimley Park Hospital in Surrey, UK.

Jonny Wilkinson, MD, (@wilkinsonjonny) is a consultant in intensive care medicine and anesthesia at Northampton General Hospital in Northampton, UK.

Ashley Miller, MD, (@icmteaching) is a consultant in anesthesia and intensive care medicine at Shrewsbury and Telford Hospitals in Shropshire, UK.
References
- Mahjoub Y, Lejeune V, Muller L et al. 2014 Evaluation of pulse pressure variation validity criteria in critically ill patients: a prospective observational multicentre point- prevalence study. Br J Anaesth. 2014;112(4):681–685. https://doi.org/10.1093/bja/aet442
- Miller A, Peck M, Clark T, et al. FUSIC HD. Comprehensive haemodynamic assessment with ultrasound. J Intensive Care Soc. 2022;23(3):325–333. https://doi.org/10.1177/17511437211010032
- Eyeington CT, Lloyd-Donald P, Chan MJ, et al. Rapid response team review of hemodynamically unstable ward patients: the accuracy of cardiac index assessment. J Crit Care. 2019;49:187–192. https://doi.org/10.1016/j.jcrc.2018.09.002
- Nagueh SF, Smiseth OA, Appleton CP, et al. Recommendations for the evaluation of left ventricular diastolic function by echocardiography: an update from the American Society of Echocardiography and the European Association of Cardiovascular Imaging. J Am Soc Echocardiogr. 2016;29(4):277–314. https://doi.org/10.1016/j.echo.2016.01.011
- Luxford J, Bassin L, D’Ambra M. Echocardiography of the tricuspid valve: acknowledgements. Ann Cardiothorac Surg. 2017;6(3):223–239. https://doi.org/10.21037/acs.2017.05.15
- Augustine DX, Coates-Bradshaw LD, Willis J, et al. Echocardiographic assessment of pulmonary hypertension: a guideline protocol from the British Society of Echocardiography. Echo Res Pract. 2018;5(3):G11–G24. https://doi.org/10.1530/erp-17-0071
- Mullens W, Abrahams Z, Francis GS, et al. Importance of venous congestion for worsening of renal function in advanced decompensated heart failure. J Am Coll Cardiol. 2009;53(7):589–596. https://doi.org/10.1016/j.jacc.2008.05.068
- Miller A, Mandeville J. Predicting and measuring fluid responsiveness with echocardiography. Echo Res Pract. 2016;3(2):G1–G12. https://doi.org/10.1530/erp-16-0008
- Beaubien-Souligny W, Rola P, Haycock K, et al. Quantifying systemic congestion with point-of-care ultrasound: development of the venous excess ultrasound grading system. Ultrasound J. 2020;12(1):16. https://doi.org/10.1186/s13089-020-00163-w
- Rubino A, Peck M, Miller A, et al. Focused Transoesophageal Echocardiography (fTOE). Retrieved from: https://www.ics.ac.uk/Society/Learning/Focused_Ultrasound/fTOE/Society/Learning/focused_TOE.aspx?hkey=1014de14-7c24-475c-a24f-68f41504187d
Leave a commentOrder by
Newest on top Oldest on top