POCUS Spotlight: Advanced Focused Assessment in Transthoracic Echocardiography (FATE)
Cite as: Borde D, Chidambaram K, Dikshit A, et al. POCUS spotlight: advanced focused assessment in transthoracic echocardiography (FATE). ASRA Pain Medicine News 2023;48. https://doi.org/10.52211/asra110123.009.
Introduction
Recently, the American Society of Anesthesiologists Ad Hoc Committee on Point-of-Care Ultrasound (POCUS) issued recommendations. This document affirmed the practice of diagnostic POCUS by adequately trained anesthesiologists and identified the relevant scope of practice. The committee recommended a minimum of 50 focused cardiac ultrasound (FoCUS) supervised studies personally performed and interpreted and another 100 studies interpreted but not necessarily personally performed to achieve competence.1 Also, the European Association of Cardiovascular Imaging prepared a guide in close cooperation with representatives of the European Society of Anaesthesiology and the European Association of Cardiothoracic Anaesthesiology and Intensive Care that aimed to provide key principles for implementing FoCUS, promoting its teaching and training while encouraging teamwork and the development of the field.2 However, this readily accessible tool cannot completely replace patient history, physical examination, clinical judgment, and other formal imaging modalities read by a specialist. Basic Focus Assessed Transthoracic Echo (FATE) is designed for answering a given clinical question with a binary answer of yes or no. Still, there is a concern about overdiagnosis and undertreatment of various clinical pathologies when using POCUS.3 Hence, knowledge about Advanced FATE can reduce these errors in clinical practice and further improve confidence in using POCUS as a diagnostic tool.
Table 1: Indications of advanced FATE.
- Evaluation of left ventricular function in patients with history of ischemic heart disease and recent worsening of clinical signs/symptoms or if the echocardiogram was not done recently.
- Patients with no known history of heart disease but presenting with signs/symptoms of heart disease or with abnormal chest x-rays or electrocardiograms.
- Patients with murmurs and symptoms of heart disease but were never evaluated by echocardiogram.
- Patients in whom functional status could not be evaluated, such as the elderly or patients with significant osteoarthritis.
- Patients with significant pulmonary hypertension and right ventricular dysfunction.
- Patients at high risk for pulmonary embolism like trauma of long bones and bedridden patients.
- Patients with new onset arrhythmias.
- Patients having emergency surgery to rule out significant cardiac diseases.
- Patients with significant pulmonary hypertension and right ventricular dysfunction.
- Patients with abnormal chest x-rays or electrocardiograms as shown in Table 1.4
A previous article in this newsletter, “POCUS Spotlight: Focused Cardiac Ultrasonography,” discussed the basic utility of ultrasound in making some essential diagnoses.5 This article will further outline some more detailed measurements relevant in cardiac examination by discussing Advanced FATE, which encompasses extended views (Table 2), the basics of Doppler examination with pressure estimation, and cardiac output measurement.
Table 2: Advanced FATE views image acquisition and clinical utility.
| Views | Steps | ||||
| 1. Position of the Patient | 2. Find the Window | 3. Place the Transducer | 4. Identify the Structures | 5. Clinical Utility | |
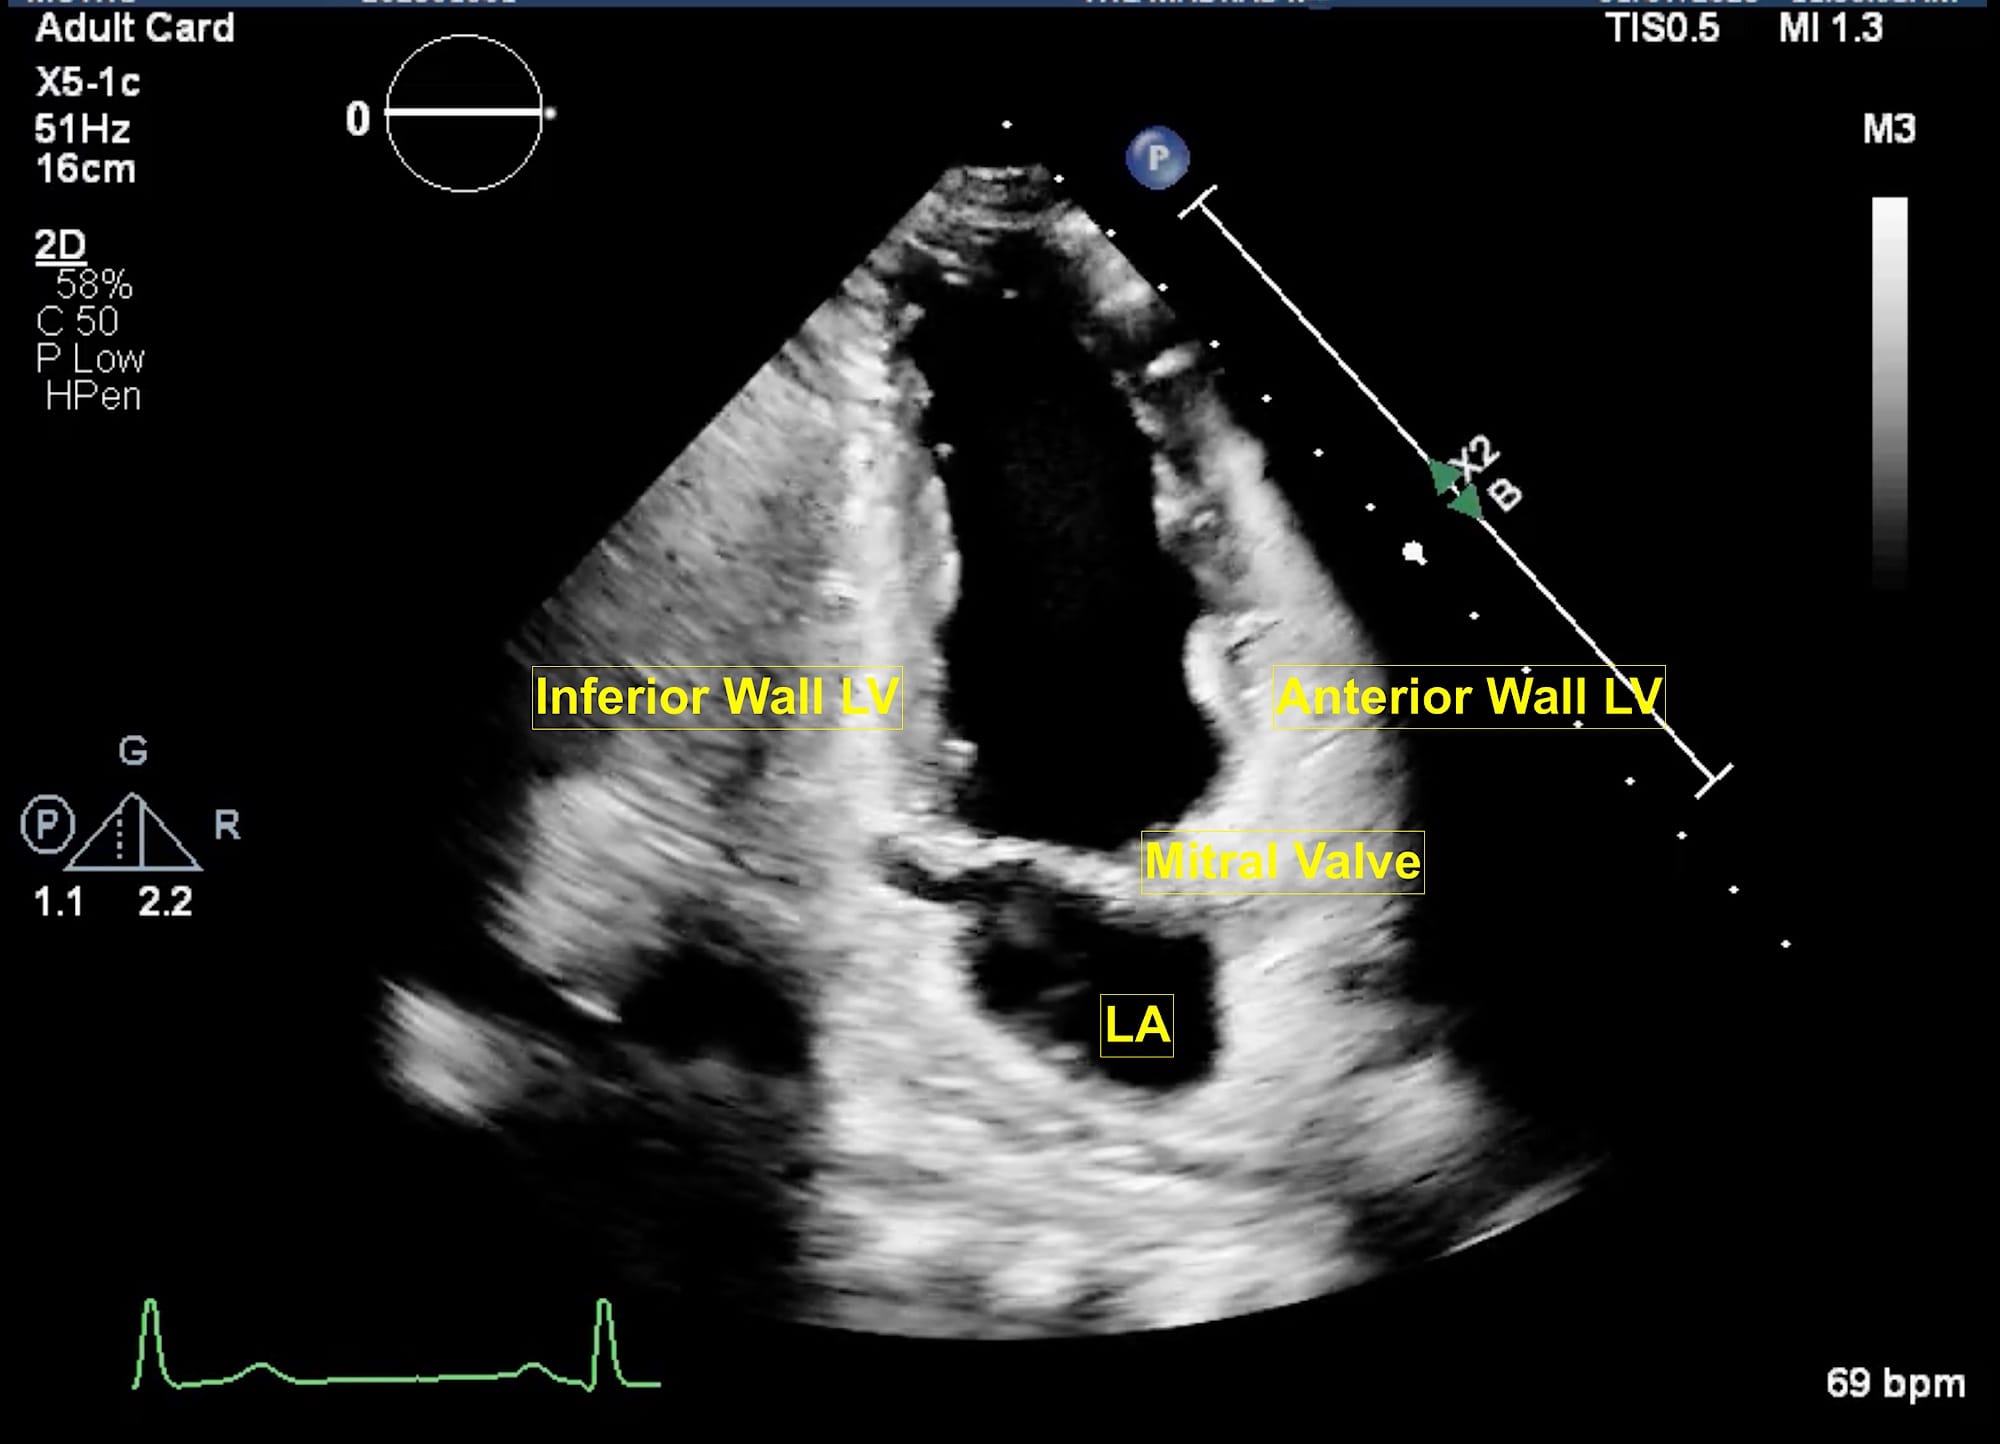
| Apical Two- Chamber | Left lateral tilt by 45 degrees; left arm extended | Feel the apex beat just below the left nipple | Rotate counterclockwise 60 degrees from apical four-chamber view; orientation marker pointed towards left shoulder | Left atrium Mitral Valve Left ventricle (anterior wall and inferior wall) | LV function RWMA |
| Apical Long Axis (Three-Chamber) | Left lateral tilt by 45 degrees; left arm extended | Feel the apex beat just below the left nipple | Rotate counterclockwise by 120 degrees from apical four-chamber view | Left atrium Mitral valve Left ventricle (inferolateral wall and anteroseptal wall) Aortic valve | LV function Mitral regurgitation Aortic stenosis Aortic insufficiency |
| Apical Five-Chamber | Left lateral tilt by 45 degrees; left arm extended | Feel the apex beat just below the left nipple | Tail down from apical four-chamber view | Left atrium Mitral valve Left ventricle with LV outflow tract Aortic valve Right atrium Right ventricle | LV function LV outflow track VTI for cardiac output measurement Aortic stenosis |
| Parasternal Short Axis Mitral Plane | Left lateral tilt; left arm extended (supine usually works) | Just to the left of the sternum second through fourth interspace (high in obese and low in slender patients) | Rotate the probe from PLAX view to face the marker to left shoulder | Right ventricle Interventricular septum Basal segments of LV Mitral valve leaflets | RWMA MV leaflets |
| Parasternal Aortic Short Axis | Left lateral tilt, left arm extended (supine usually works) | Just to the left of the sternum second through fourth interspace (high in obese and low in slender patients) | Rotate the probe from PLAX view and tail down to face the marker to left shoulder | Left atrium Inter-atrial septum Right atrium Tricuspid valve Right ventricle Pulmonary valve Aortic valve | Tricuspid regurgitation ASD Pulmonary valve Aortic valve leaflets |
| Parasternal Long Axis RV In-Flow View | Left lateral tilt, left arm extended (supine usually works) | Just to the left of the sternum second through fourth interspace | Turn the transducer inferiorly towards right hip | Right atrium Tricuspid valve Right ventricle | Tricuspid regurgitation |
| Parasternal Long Axis RV Out-Flow View | Left lateral tilt, left arm extended (supine usually works) | Just to the left of the sternum second through fourth interspace | Tilt the transducer anteriorly from the PLAX view and rotate slightly clockwise | Right ventricular outflow track Pulmonary valve Pulmonary artery | Pulmonary stenosis Regurgitation Pulmonary embolus |
| Suprasternal View | Supine with neck turned slightly to right | Suprasternal notch | Orientation mark directed to back and left of the patient | Ascending aorta Arch of aorta Descending aorta Brachiocephalic trunk Left subclavian Common carotid artery | Dissection of aorta Aortic stenosis |
ASD = atrial septal defect, LV = left ventricle, PLAX = parasternal long axis view, MV = mitral valve, RWMA = regional wall motion abnormalities, RV = right ventricle, VTI = velocity time integral.
It is recommended that the operator should always select the “cardiac” pre-set on the ultrasound machine to optimize the image quality and reduce the time required for adjustments.
The extended views are acquired through several echocardiographic windows (subcostal, apical, and parasternal). Since one of the extended views of the inferior vena cava (IVC) in the subcostal window has been discussed previously,5 only the other views will be discussed in this article. These views are obtained to further assess the Doppler measurements, which are a key aspect of Advanced FATE. This is particularly important to further minimize errors in measurement and interpretation.
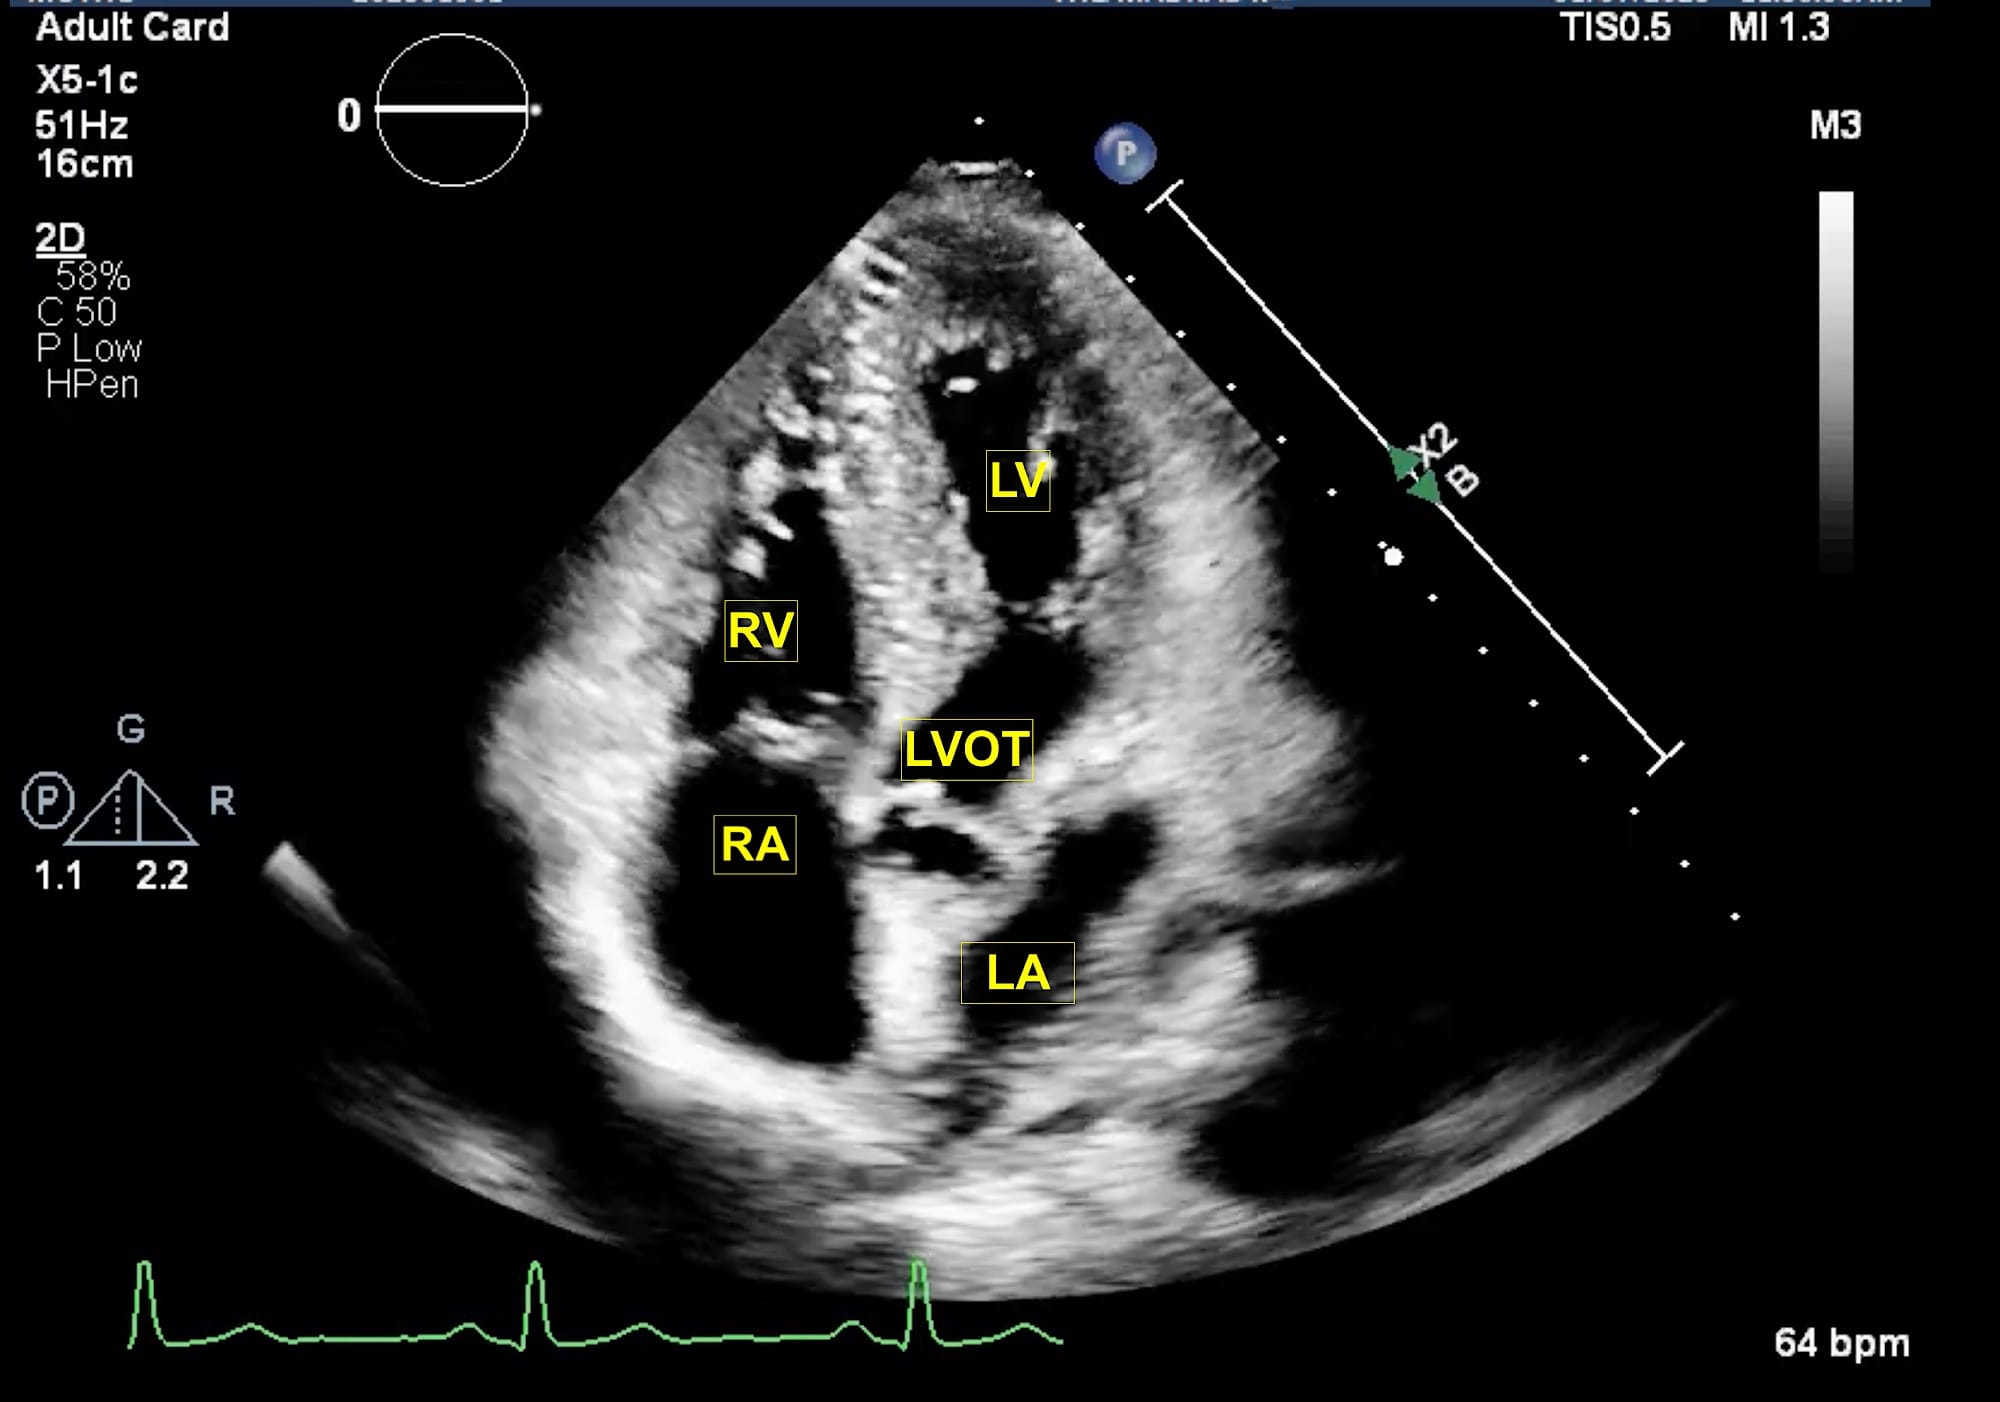
LA = left atrium, LV = left ventricle, LVOT = left ventricular outflow tract, RA = right atrium, RV = right ventricle.
The extended apical views are typically obtained with the patient in a left lateral tilt of 45 degrees. Usually, the apex is located in the left fourth or fifth intercostal space. The apical four-chamber view is obtained with the marker pointing towards the left shoulder. This is the basic view and acts like a “landmark” whenever there is difficulty in obtaining other extended views. From this view, if the transducer is tilted anteriorly, typically performed by a “tail-down” maneuver , the left ventricle outflow tract (LVOT) and aortic valve (AV) are visualized in the apical five-chamber view (Figure 1). A color flow window is then focused on the LVOT and AV. This view is very useful for evaluating the LVOT-Velocity Time Integral (VTI) for cardiac output measurement as described in the next section. A pulse wave Doppler (PWD) is placed approximately 1 cm proximal to the AV to obtain the LVOT envelope (below the baseline). This is carefully traced to obtain the LVOT VTI. This view is also very useful in assessment of AV pathologies, such as aortic stenosis (AS), aortic regurgitation (AR), or hypertrophic cardiomyopathy. To assess these pathologies, first the color flow Doppler is applied to determine the blood flow direction. There will be a turbulent flow in AS patients. In cases with AR, there will be a red blood flow jet. A continuous wave Doppler (CWD) is then applied to assess forward (below the baseline) or backward (above the baseline) blood flow. The shape of the CWD envelope is also important in identifying pathologies. For example, in cases of hypertrophic cardiomyopathy with obstruction, the CWD envelope is a typical dagger-shape. By performing a “tail-up” maneuver, again the apical four-chamber view is obtained. From this view the transducer is rotated counterclockwise 60 degrees with the orientation marker pointed towards the left shoulder to obtain the apical two-chamber view (Figure 2). This view is useful for assessment of LV systolic function and ejection fraction calculation. It demonstrates the anterior and inferior walls of LV and any regional wall motion abnormalities, which might suggest left anterior descending and right coronary artery involvement, respectively. From this view, if the probe is rotated counterclockwise, the apical long-axis or apical three-chamber view is obtained (Figure 3). This view demonstrates the atrium, mitral valve, LV (inferolateral wall and anteroseptal wall), LVOT, and AV. Similar to the apical five-chamber view, this view is useful for assessing LVOT VTI for cardiac output measurement and AV pathologies. For those at an expert level, this view enables assessment for mitral regurgitation as the anterior and posterior mitral leaflets can be visualized.
LA = left atrium, LV = left ventricle.
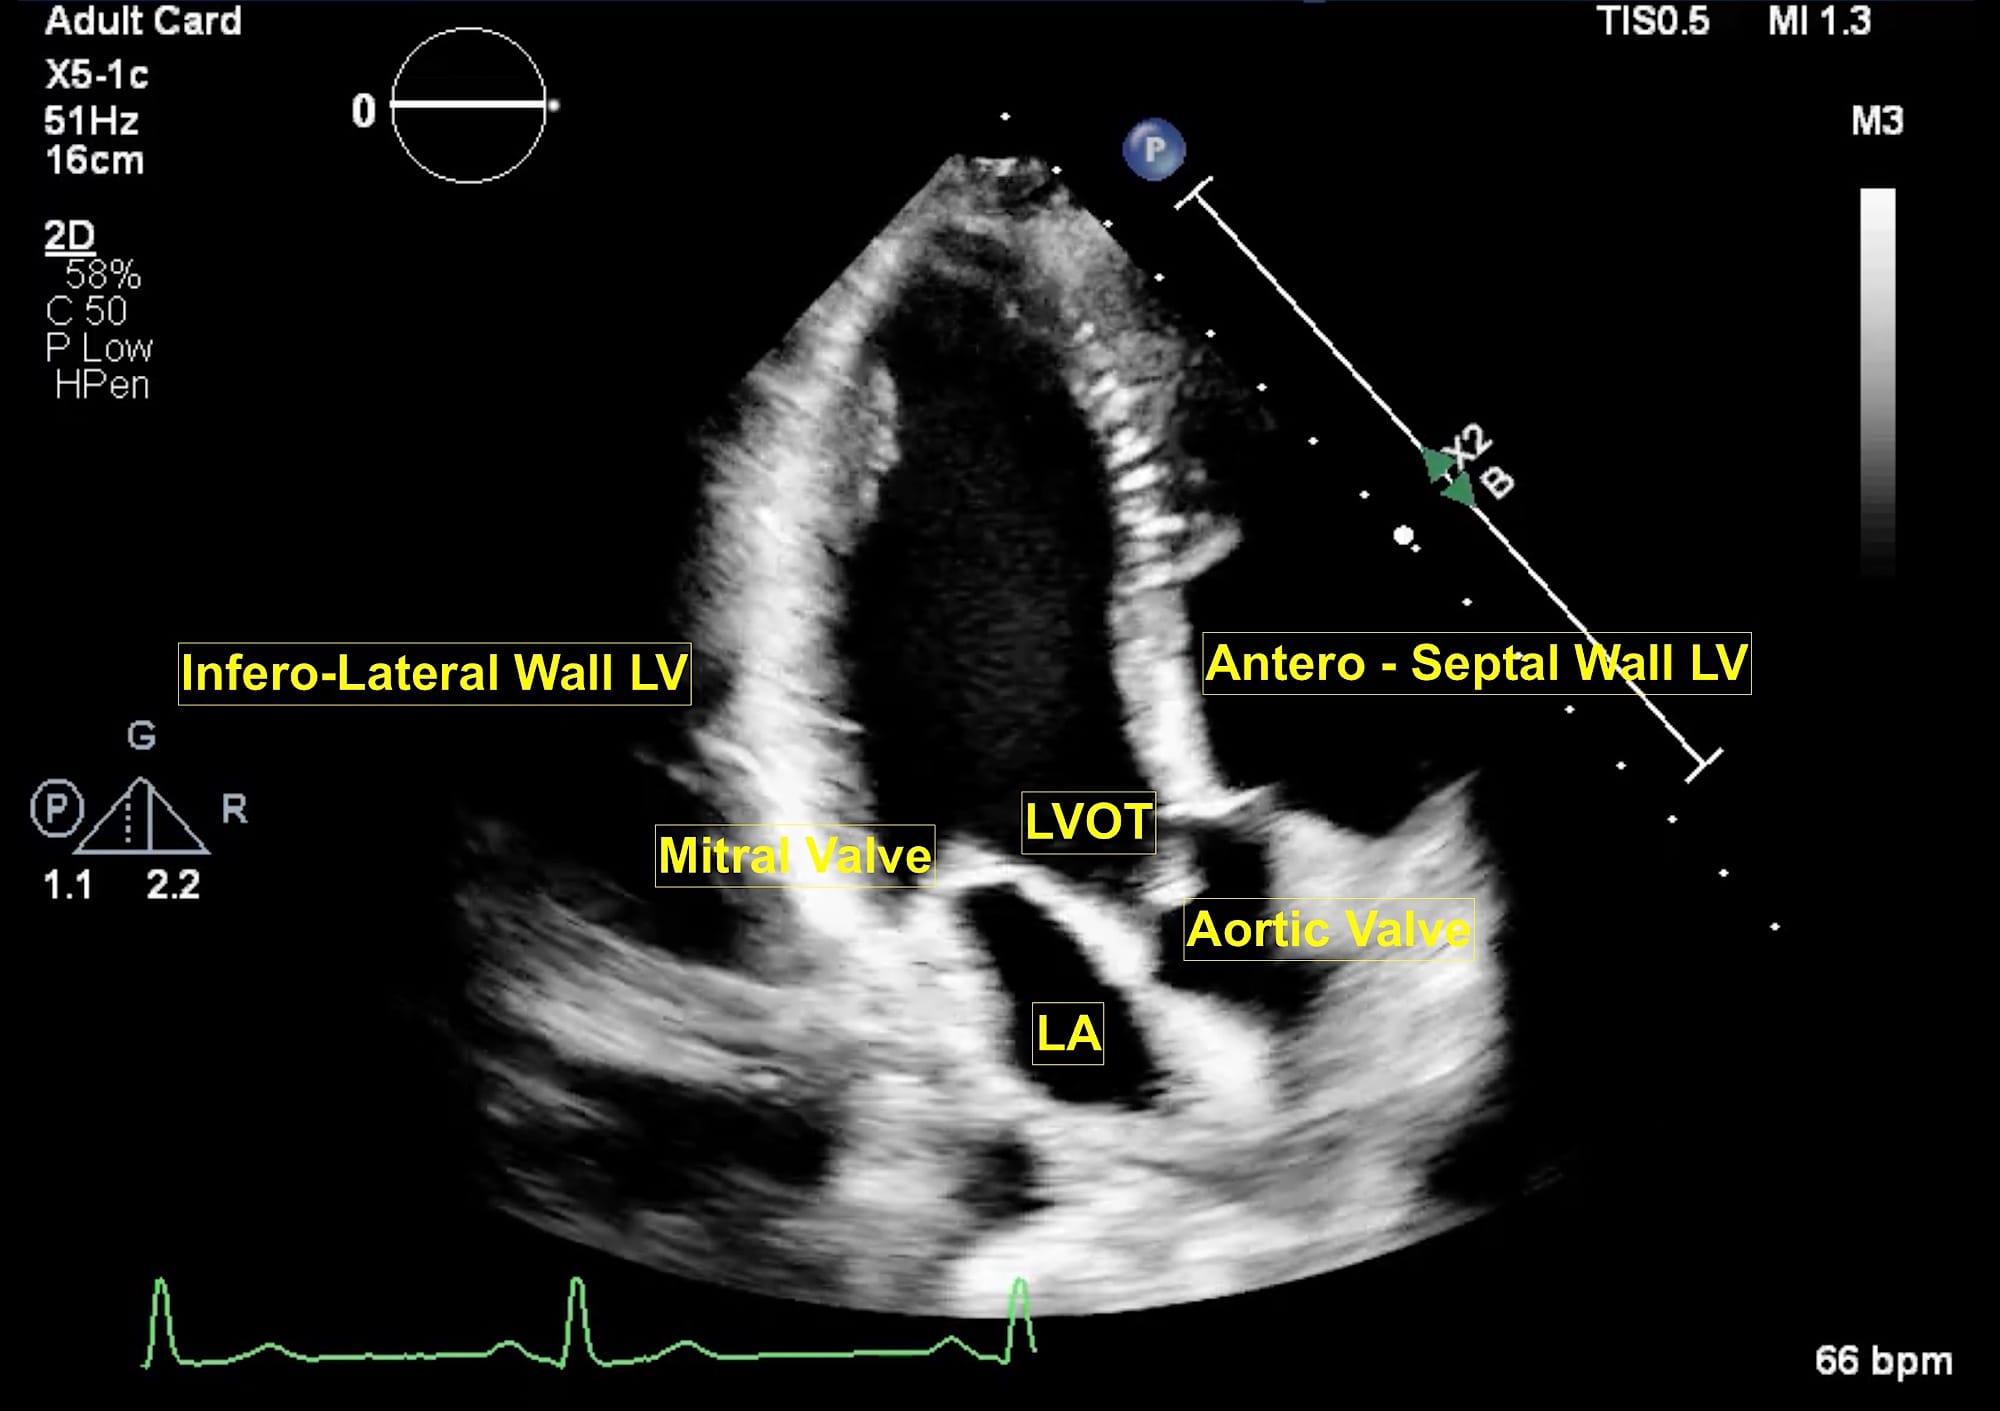
Figure 3. Apical long axis view.
LA = left atrium, LV = left ventricle, LVOT = left ventricular outflow tract, MV = mitral valve.
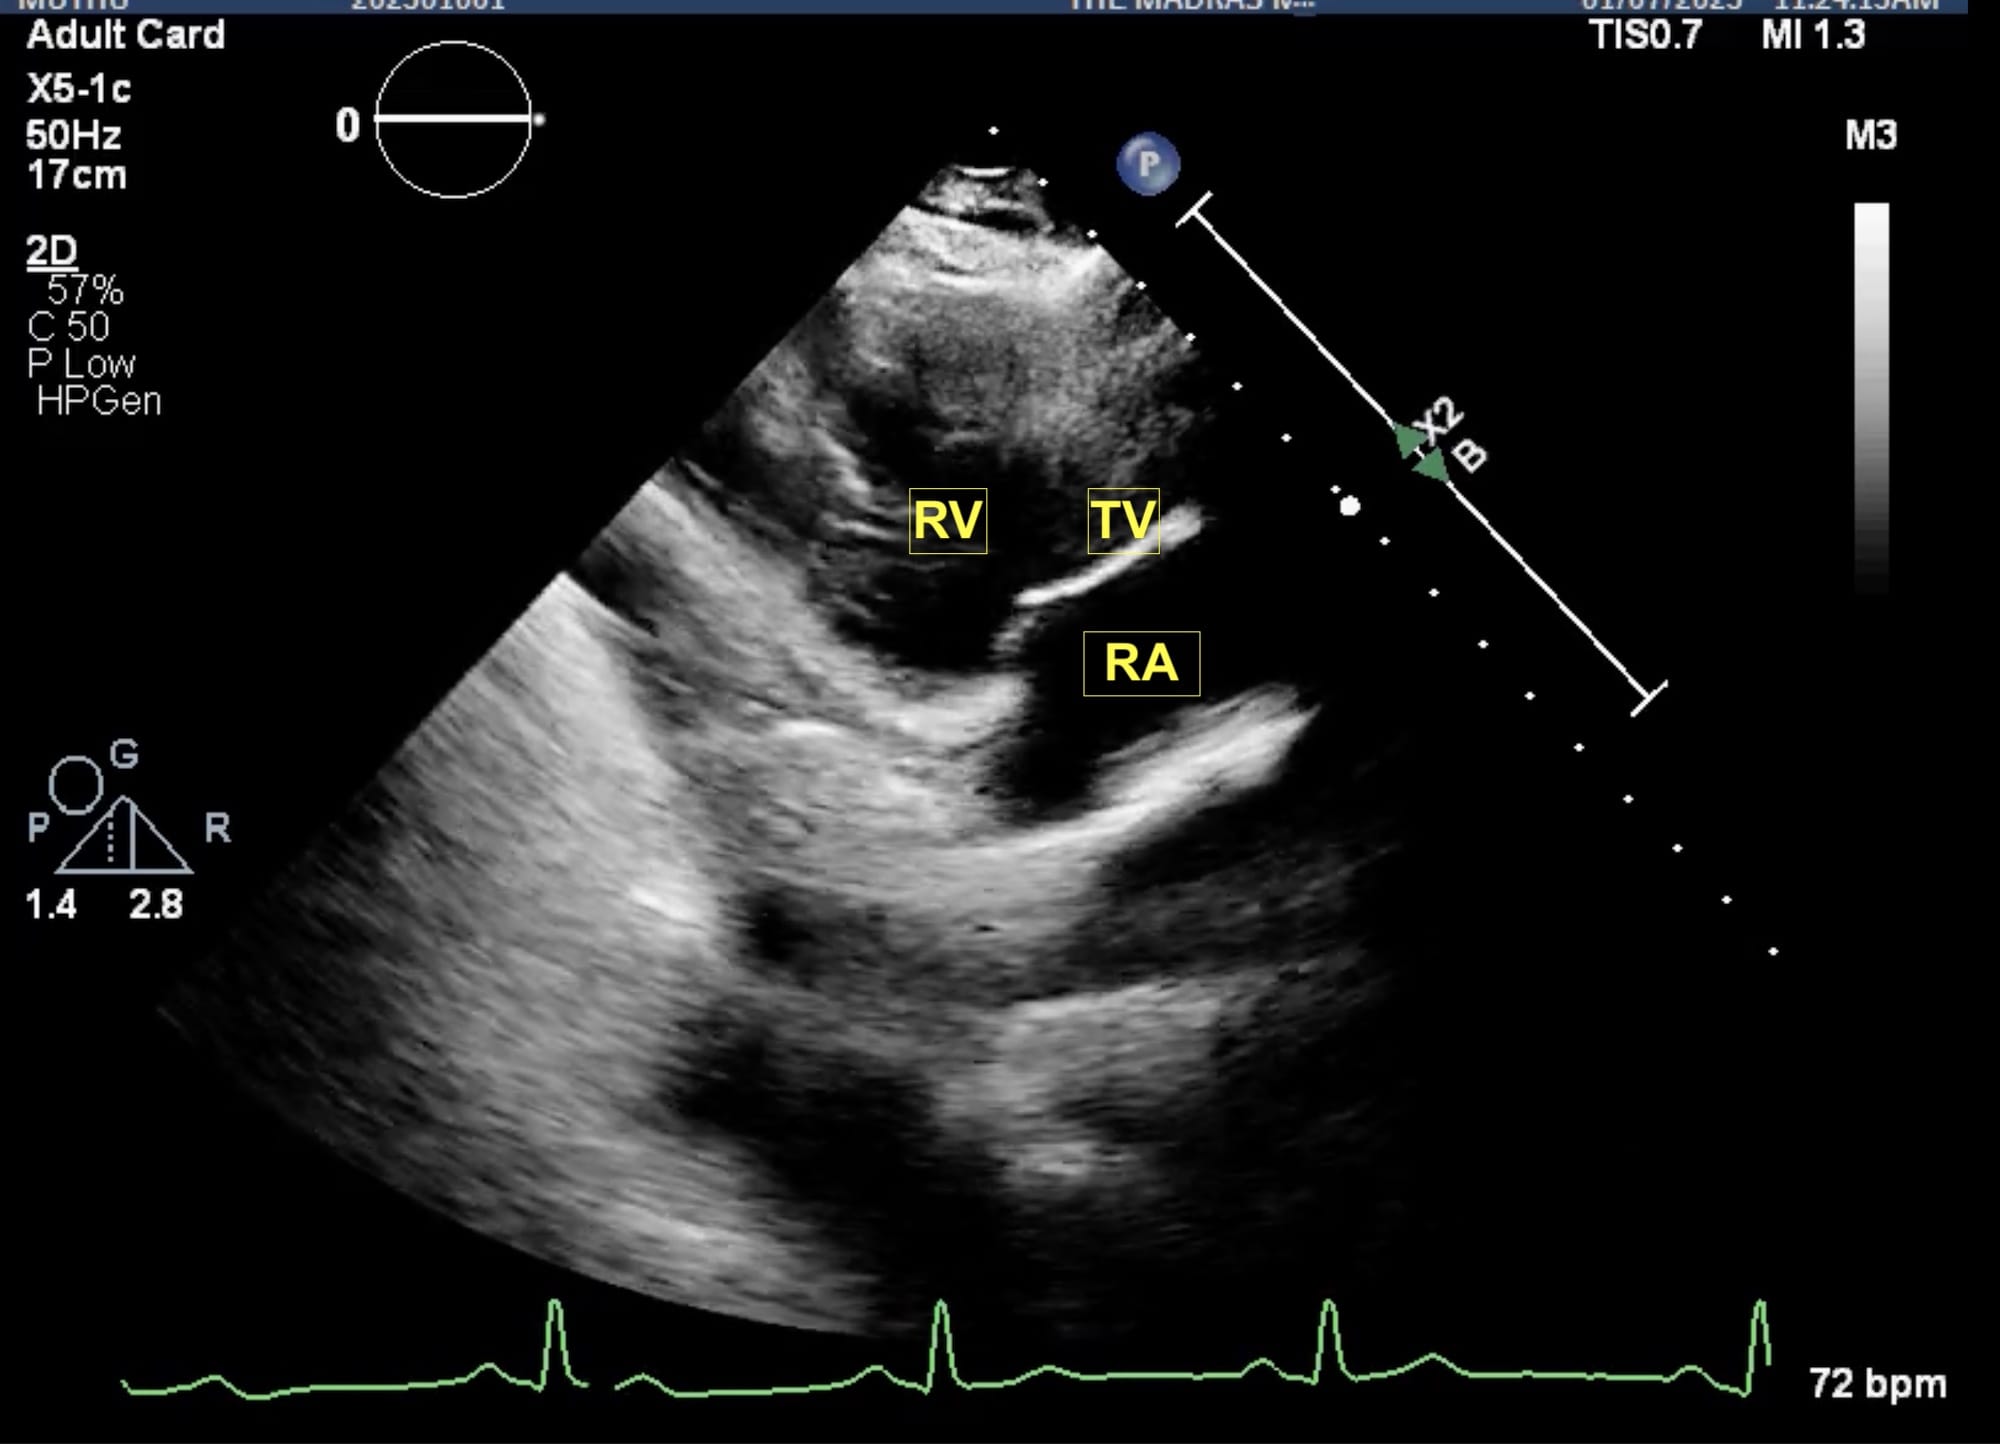
Figure 4. Parasternal RV inflow view.
RA = right atrium, RV = right ventricle, TV = tricuspid valve.
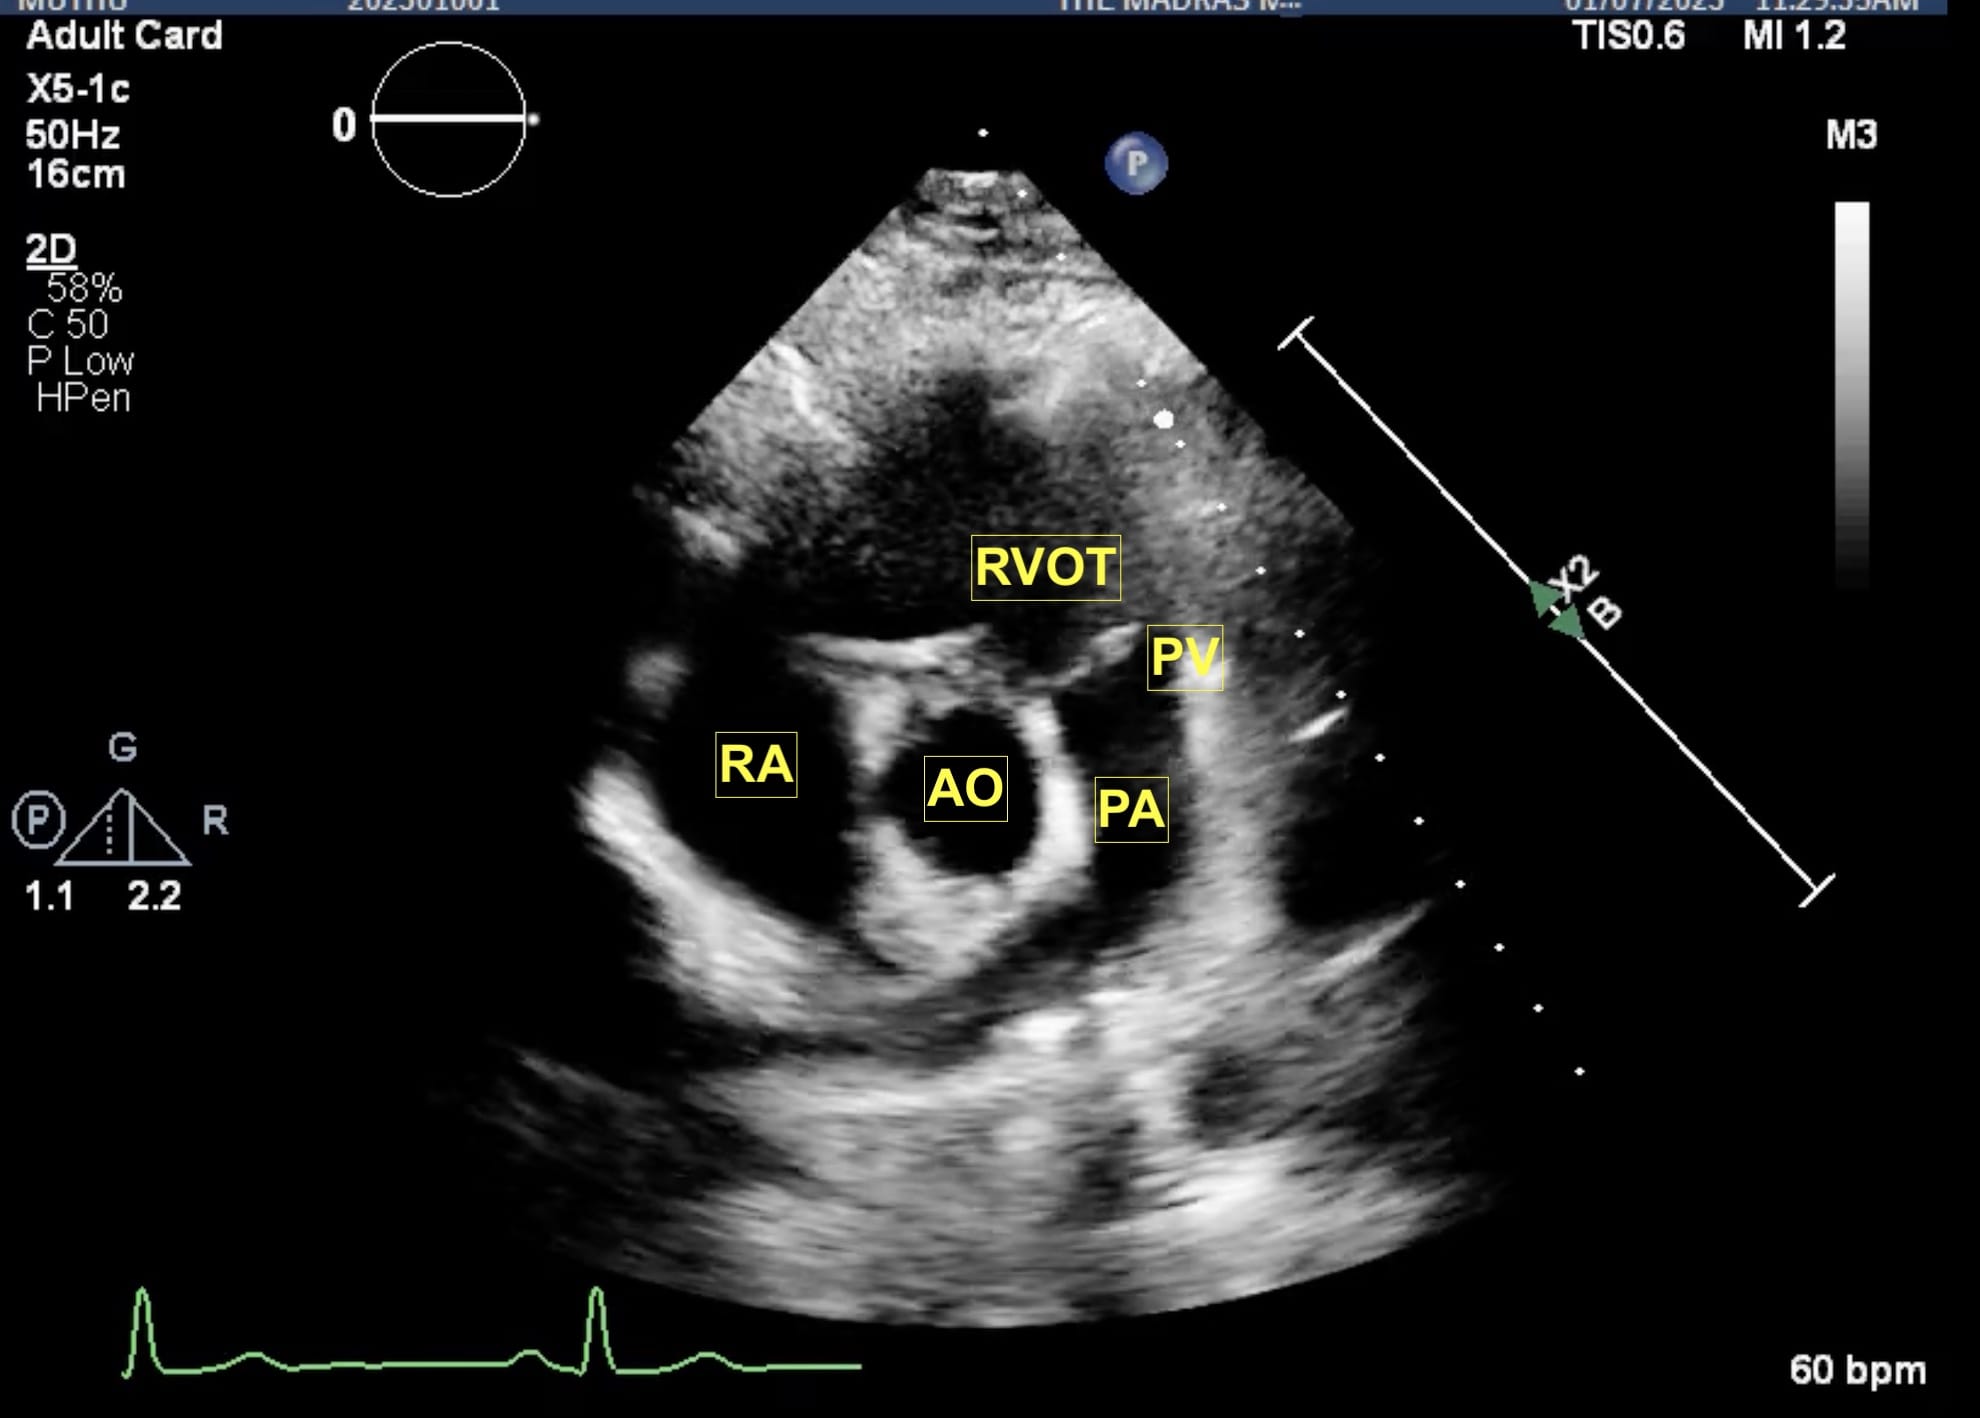
Figure 5. Parasternal RV outflow view.
AO = aorta, PA = pulmonary artery, PV = pulmonic valve, RA = right atrium, RVOT = right ventricular outflow tract.
From the parasternal long axis (PLAX) view, the right ventricular (RV) inflow view (Figure 4) is obtained by tilting the transducer inferiorly towards the patient’s right hip. The tricuspid valve (TV) appears in the center of the sector. To the upper right is the anterior wall of the RV, and to the left is the inferior wall of the RV. The right atrium (RA) and the proximal IVC are in the lower part of the sector. The right ventricular outflow tract (RVOT) view (Figure 5) enables visualization of the pulmonic valve (PV) and outflow of the RV. To obtain this view, the transducer is tilted anteriorly from the PLAX view and rotated slightly clockwise. The cardiac structures visualized in this view include the RVOT, two leaflets of the pulmonary valve, the main pulmonary artery (PA), and in some instances, the bifurcation of the PA. If the transducer is rotated clockwise from the PLAX view, two other important views can be obtained, the parasternal short axis at the mitral plane (Figure 6) and the parasternal aortic short axis view (Figure 7). The parasternal short axis view at the mitral plane is useful for assessing mitral leaflets at the anterior (left side of the screen) and posterior commissures. It provides important information about the location of mitral regurgitation jet when color flow Doppler is applied. The parasternal aortic short axis view also provides useful information regarding tricuspid regurgitation, atrial septal defects, and PV and AV function. All the parasternal views are obtained from the same window by gentle manipulation of probes with either tilt or rotation movements.
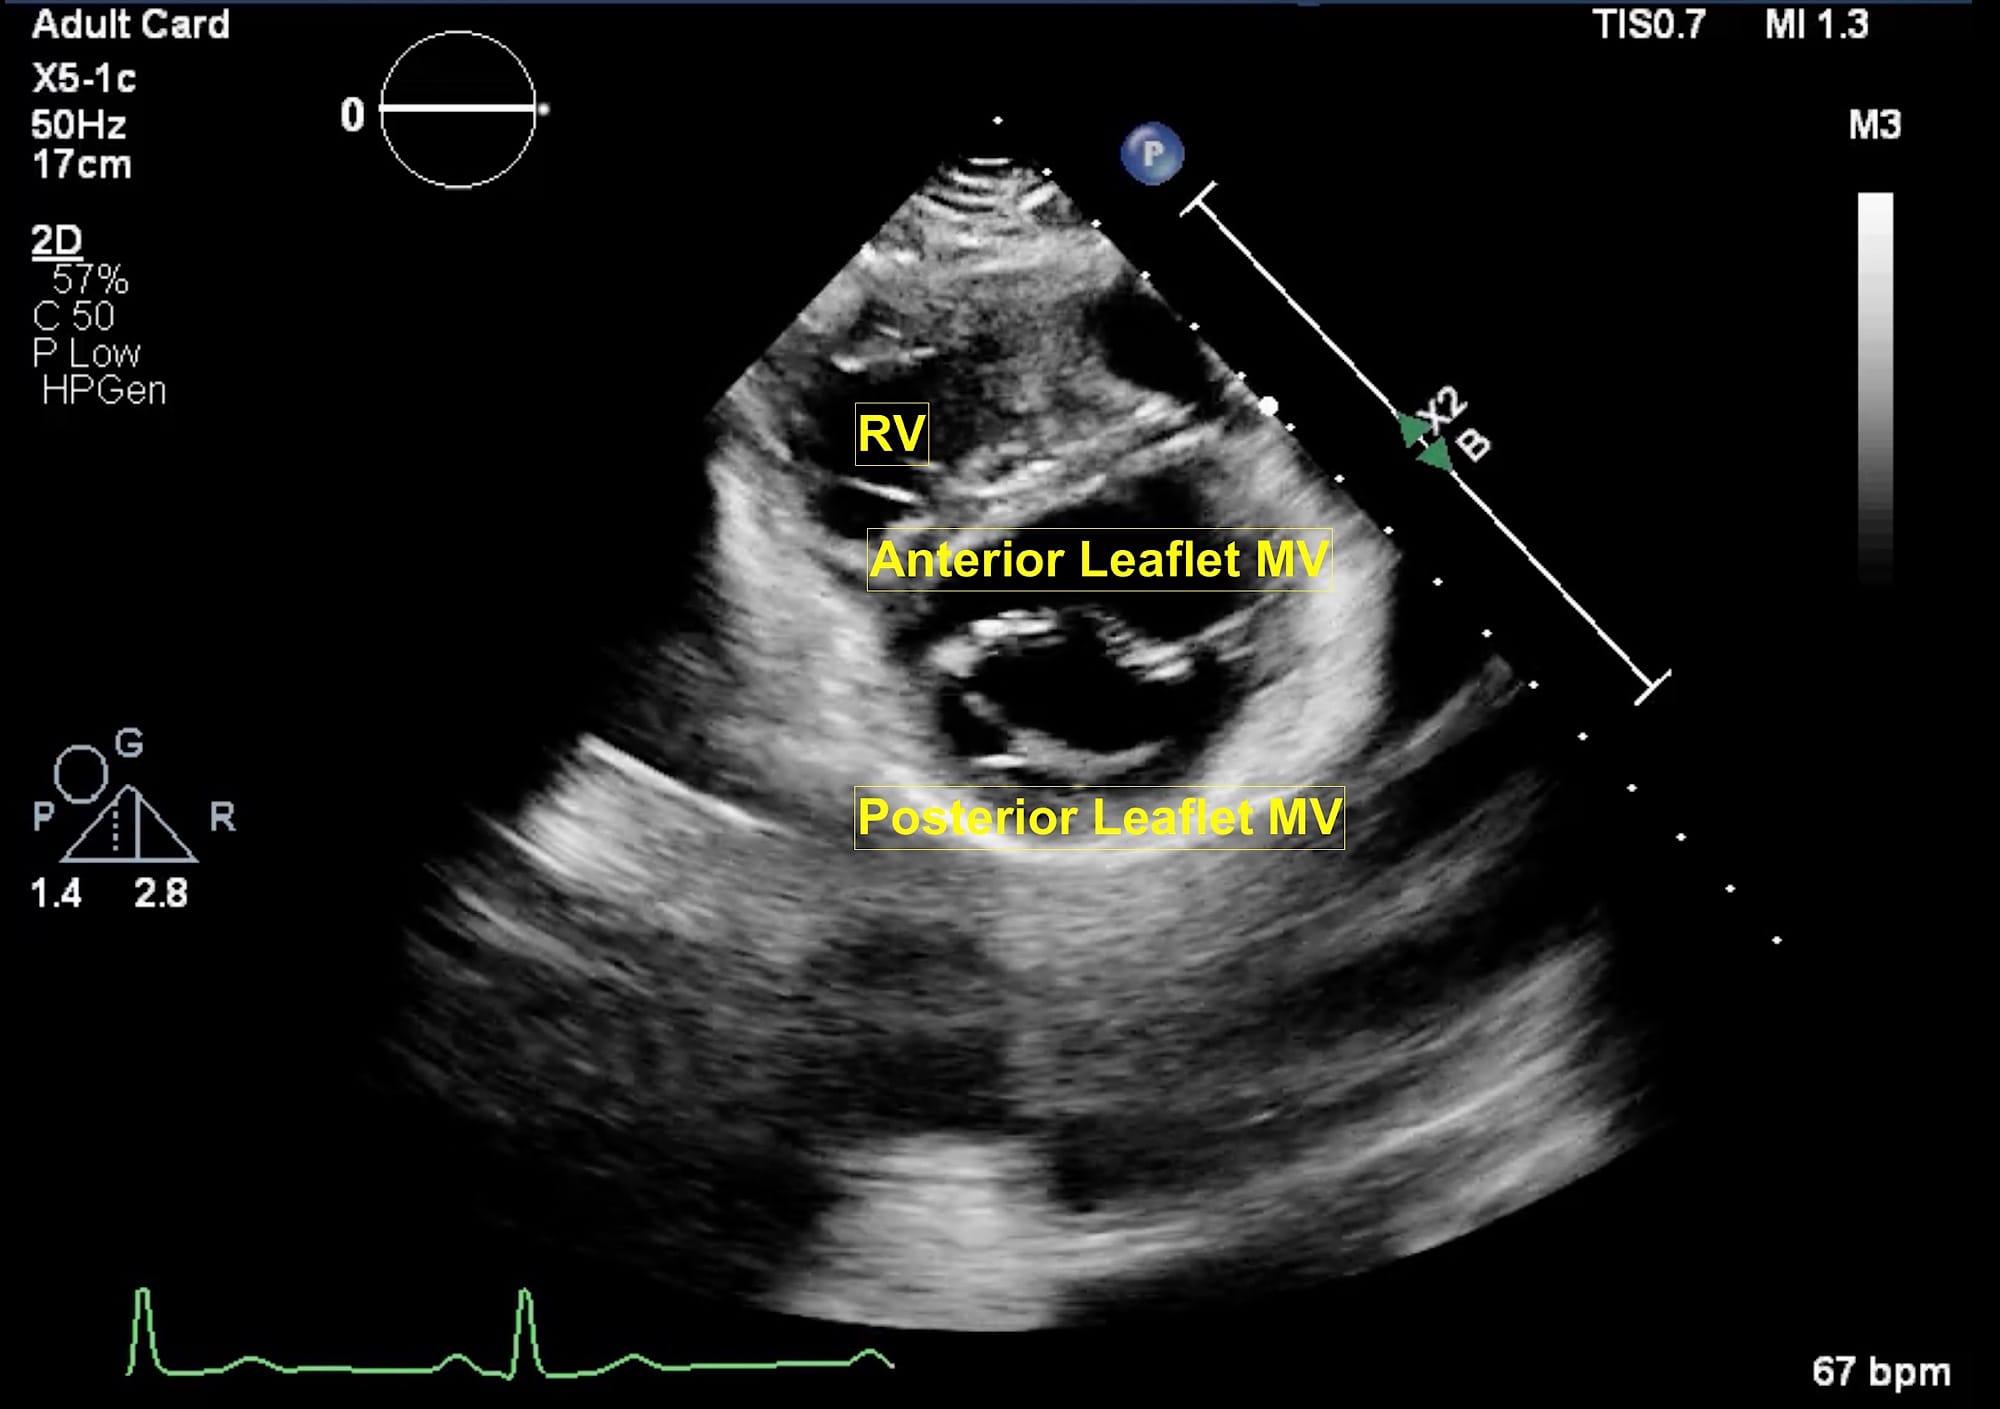
Figure 6. Parasternal short axis view at mitral valve.
MV = mitral valve, RV = right ventricle.
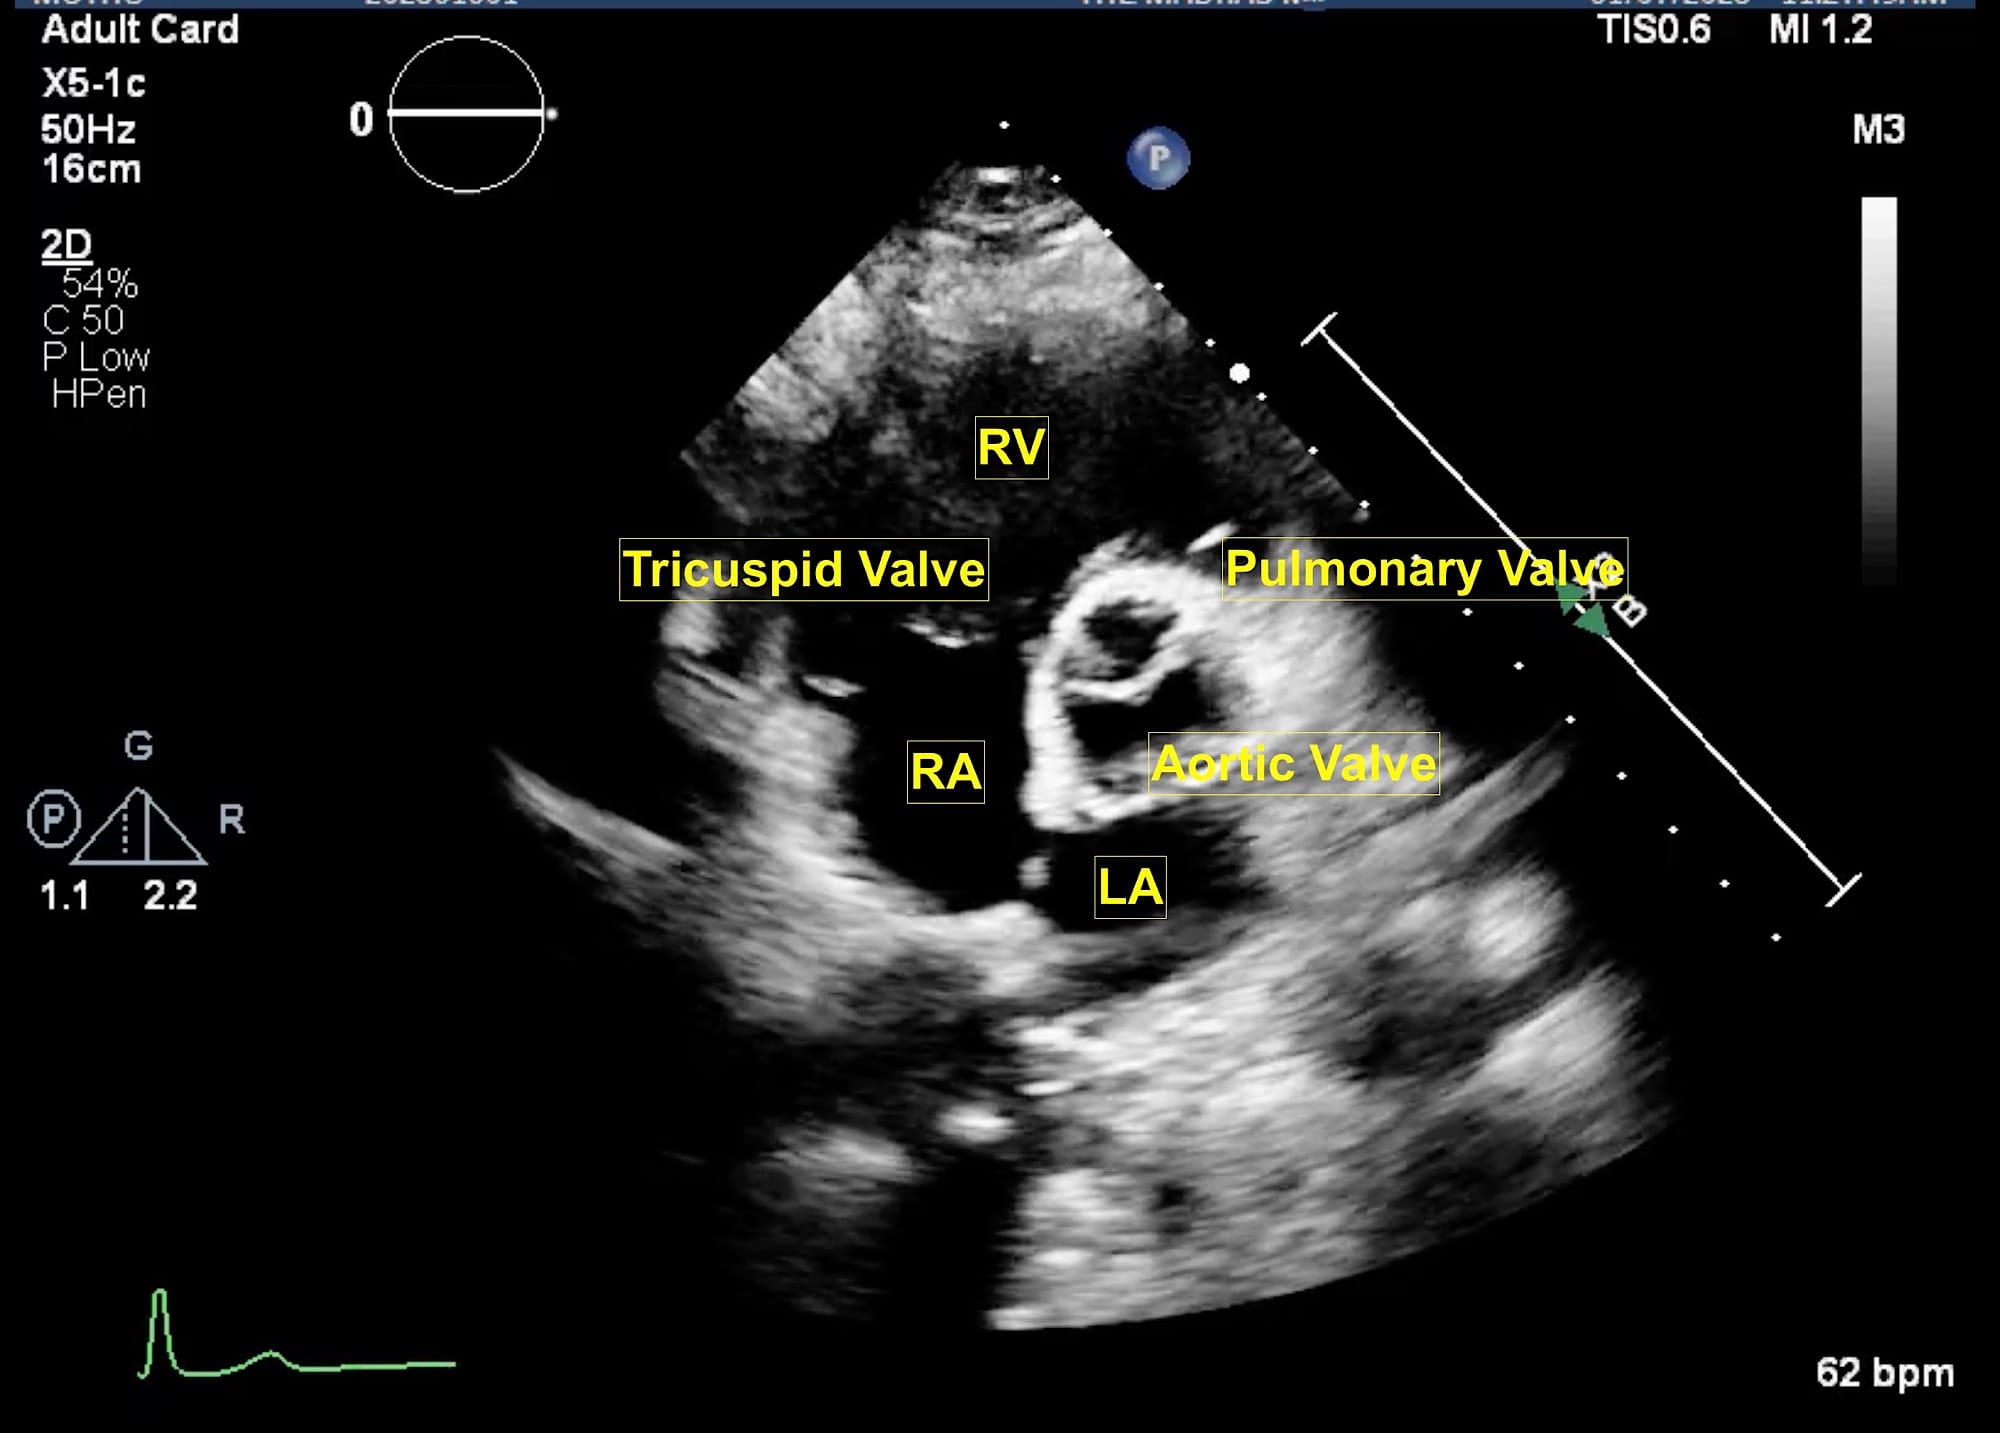
Figure 7. Parasternal short axis view at aortic valve.
LA = left atrium, RA = right atrium, RV = right ventricle.
Finally, the suprasternal view (Figure 8) is obtained with patients in a supine position with their heads slightly turned to right. The orientation marker is placed to the back and left of the patient. On the left side of the screen, ascending aorta is visualized while in the center of the screen arch of aorta and right pulmonary artery are seen. On the left of the screen, the brachiocephalic trunk, left common carotid artery, and left subclavian artery are seen followed by the descending aorta. This view is particularly useful for diagnosing aortic dissection as well as for the assessment of aortic stenosis. The probe position and orientation to obtain the views as described above and the respective echocardiographic images are shown in Video 1.
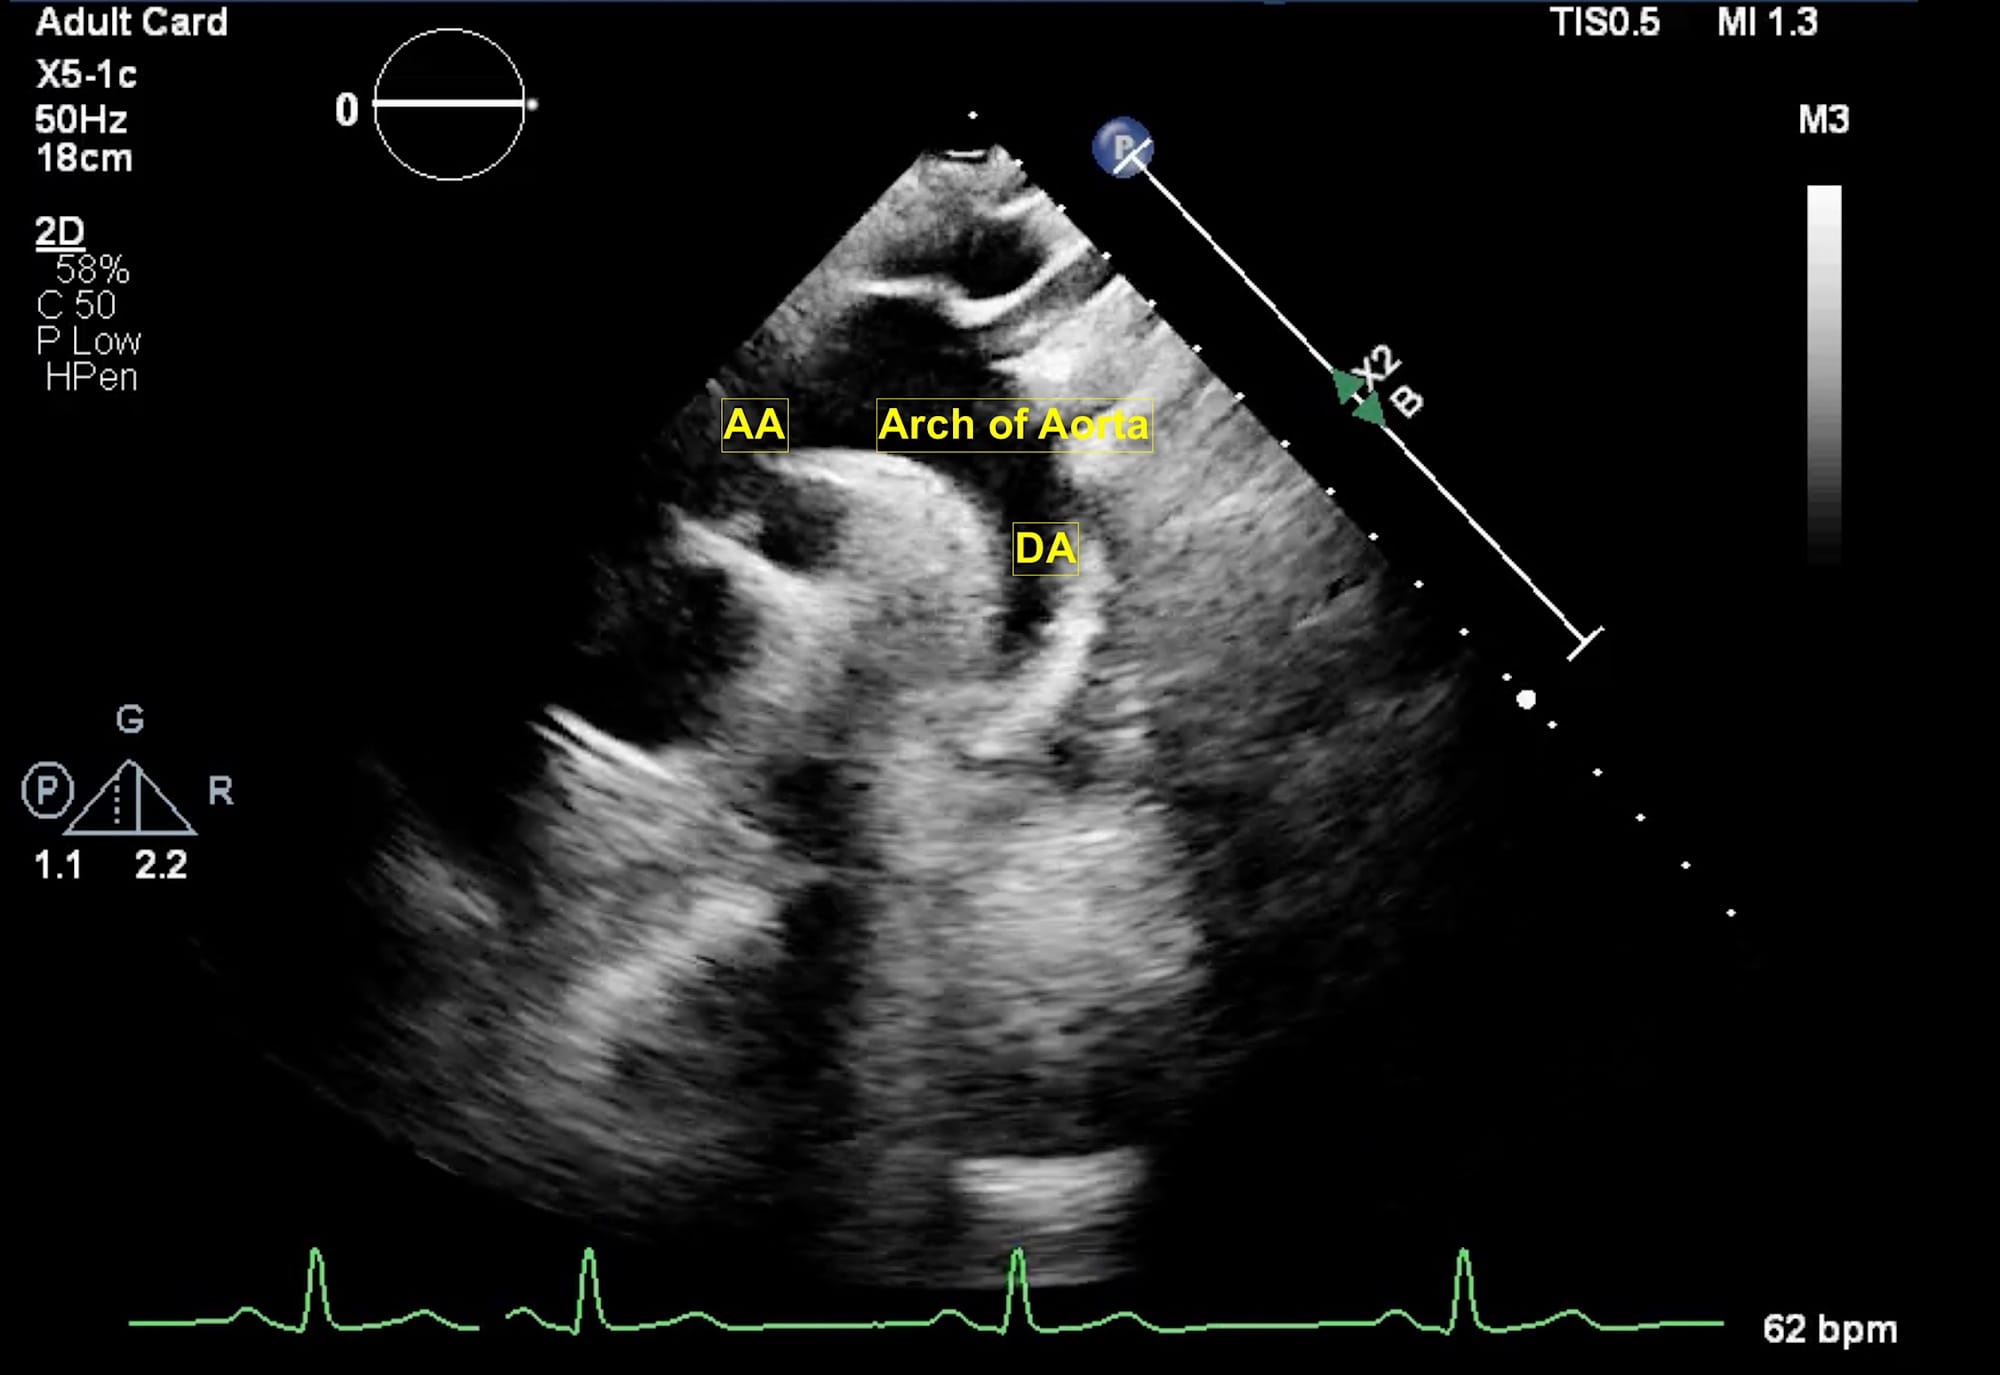
Figure 8. Suprasternal view.
AA = ascending aorta, DA = descending aorta.
Video 1
Methods of Measurement
Doppler
The Doppler effect is the phenomenon in which the frequency of a sound wave changes for an observer moving relative to the emitter of the sound. In echocardiography it is used to calculate the velocity of the blood flow and direction across various chambers of the heart. The Doppler formula permits us to calculate blood velocities based on the Doppler shift between the emitted and received signals. The formula is rearranged to give the velocity as follows:
V = Δf x C/ 2fo x Cosϴ.
V = measured velocity, Δf = Doppler frequency shift, c = average speed of ultrasound in human soft tissue (1540 m/sec), fo = emitting frequency of the transducer, Cosϴ = the cosine to the angle between the Doppler beam and the blood flow direction, 2 is a constant due to the Doppler pulse traveling to and from the transducer.
The measured velocity greatly depends on the angle between the blood flow and the ultrasound beam. Hence, it is always recommended to be as parallel as possible (ideally below 20 degrees to reduce the error below 6%-7%). Spectral (graphically displayed) Doppler and color Doppler are commonly used modalities in clinical echocardiography. The spectral Doppler modalities used most are pulsed wave Doppler and continuous wave Doppler.
Pulsed Wave Doppler (PWD)
In PWD (Figure 9A) a single piezoelectric crystal alternates between sending and receiving pulses. A “sample volume” is placed on a two-dimensional (2D) image. The ultrasound system calculates the “time of flight” for a sound pulse traveling to and from the gate. It is very useful when blood flow velocities are to be measured at the exact location (for example LVOT). The most important limitation of PWD is that it cannot measure high-flow velocities (usually > 1.2 m/s). When PWD is applied to such high flow velocities, an aliasing or wrap-around artifact occurs (Figure 10), which makes the measurement inaccurate or impossible.
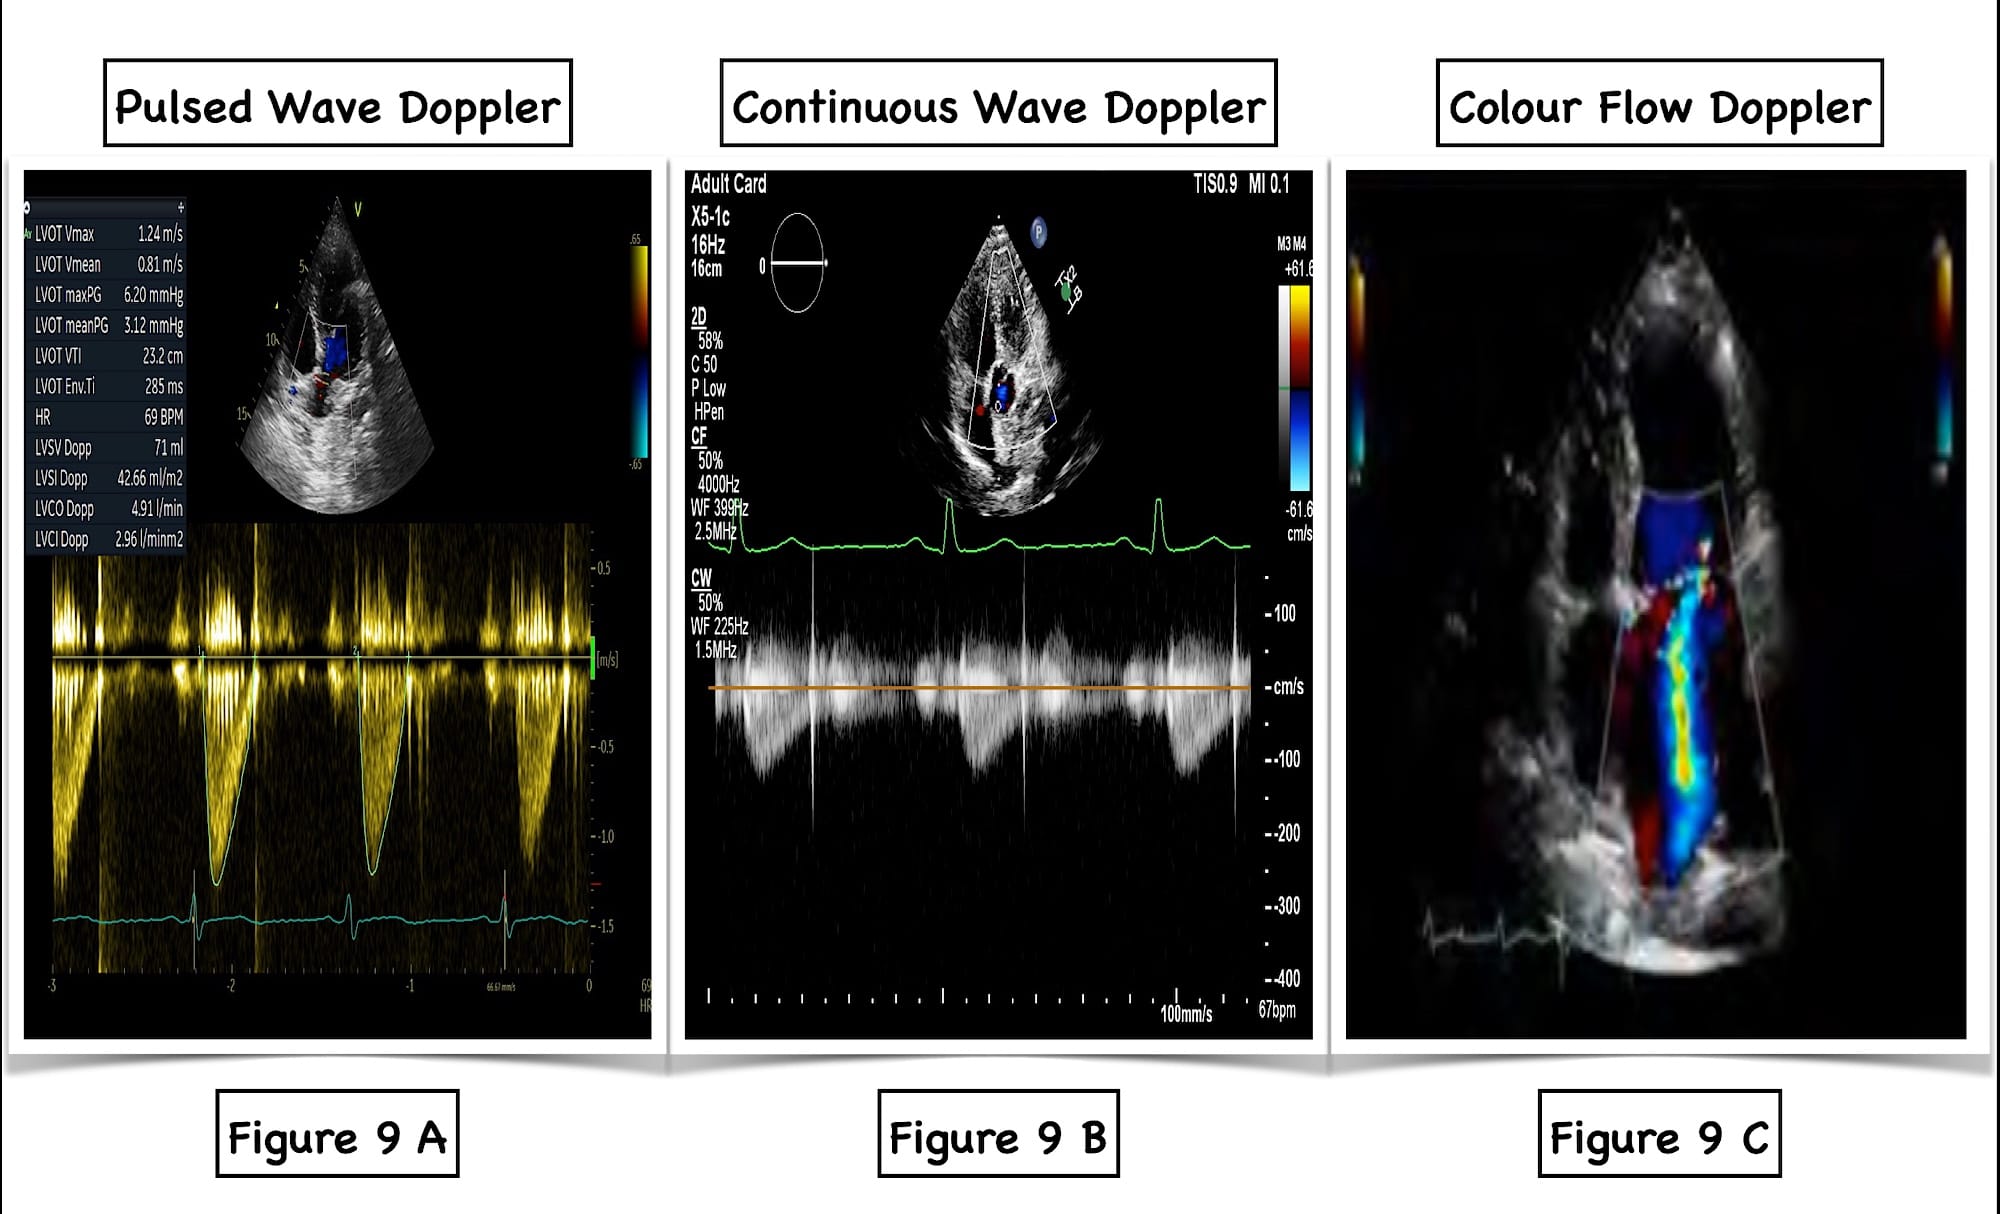
Figure 9. Various Doppler modalities.
A = pulse wave Doppler, B = continuous wave Doppler, C = color flow Doppler.
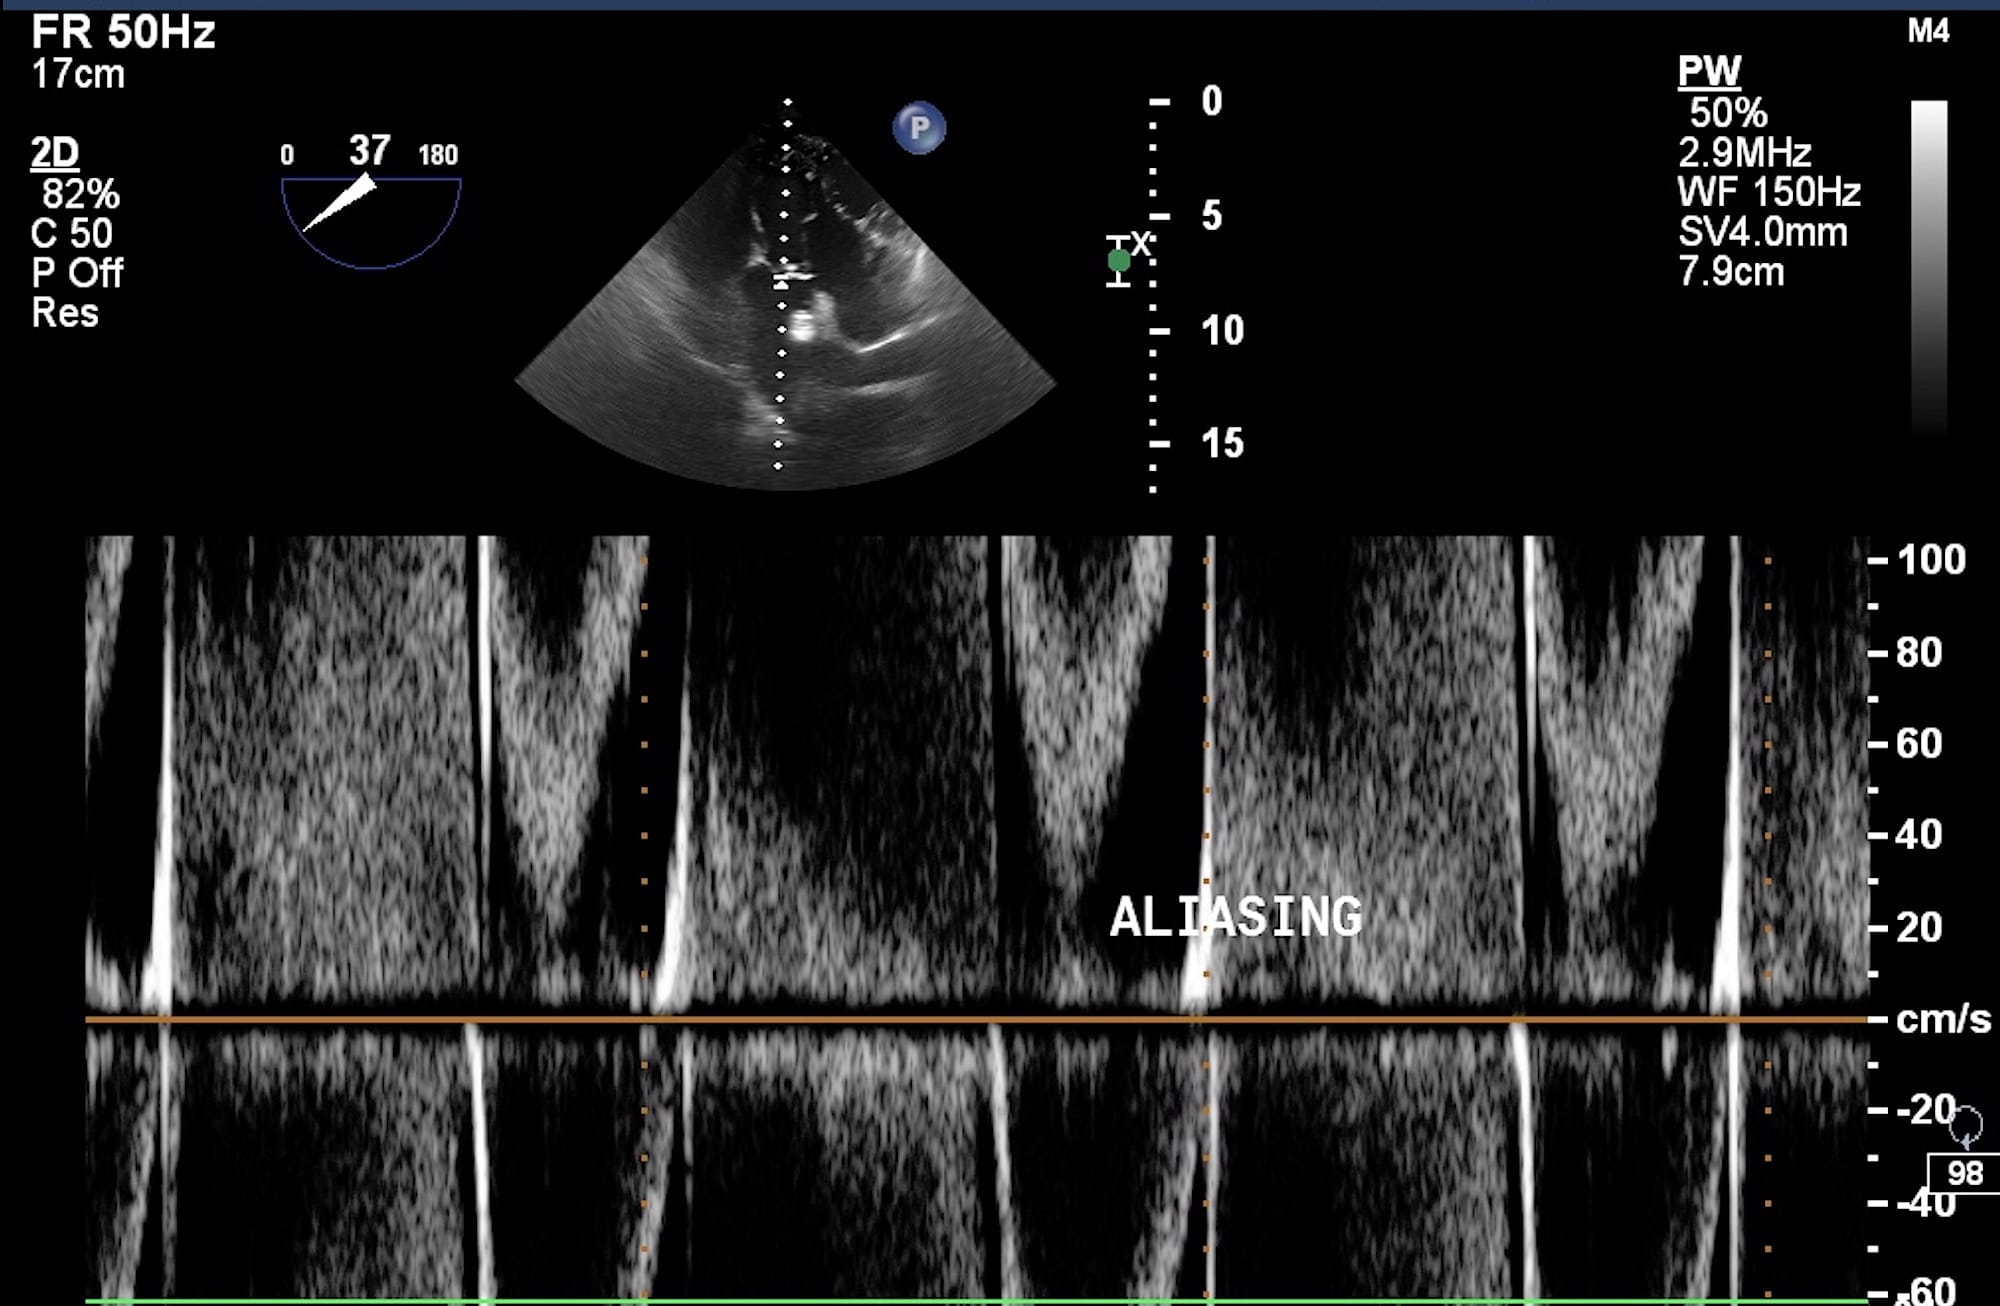
Figure 10. Aliasing artifact on pulsed wave Doppler.
Continuous Wave Doppler (CWD)
The CWD (Figure 9B) uses two crystals in the transducer, one transmitting element, which constantly transmits ultrasound, and another receiving element, which receives reflections from red blood cells (RBC). The CWD uses a large sample volume. It can accurately measure very high velocities which are important for determining severity of stenosis. The CWD can detect small Doppler shifts and low amplitude signals. Whenever there is an aliasing phenomenon on PWD, it is advisable to use CWD. The CWD has very good temporal resolution. However, certain limitations of CWD should be understood. With CWD, the exact location of moving RBC cannot be determined because the CWD measures all velocities along the ultrasound beam. This is known as range ambiguity.
Color Flow Doppler (CFD)
The color Doppler (Figure 9C) is a 2D image with color superimposed. It is very useful for determining the direction of blood flow. The acronym BART is a useful mnemonic. Blue indicates blood flow direction away from the transducer, and red indicates blood flow direction towards it. This is demonstrated in a PLAX view in Video 2. The CFD is always used before applying PWD or CWD to determine their appropriate placement.
Video 2
Pressure Estimation
The relationship between pressure and velocity is described by the Bernoulli equation as P1- P2 = 4 x (V22 – V12) mm of Hg. P1- P2 is the pressure difference between two chambers of the heart, V2 is the greater velocity, and V1 is the smaller velocity. If the smaller velocity is less than 1.5 m/s, then it can be reflected giving the simplified Bernoulli equation as ΔP = 4 x V max2.
The most common application of the simplified Bernoulli equation is calculating mean pressure gradients across the aortic valve and grading the severity of aortic stenosis. The classic Indication, Acquisition, Interpretation, and Medical Decision-Making framework is used for assessing aortic stenosis6 as demonstrated in Video 3. In brief, first the extended view either apical five-chamber or long axis is used to assess for the presence of calcification of the AV. Then, CFD is applied to assess for turbulent blood flow across the AV and used to place the CWD at an appropriate place to obtain an envelope below the baseline. The Doppler envelope is traced to obtain the mean and peak blood flow velocities, ultimately giving pressure estimation. In aortic sclerosis although the valve is calcified, the gradients across the AV are not increased. Typically, in an AV peak velocity > 4m/s, AV mean gradient > 40 mm of Hg and AV area < 1cm2 indicates severe aortic stenosis.
Video 3
Pulmonary hypertension is associated with adverse perioperative outcomes across all surgical categories.7 The assessment of pulmonary hypertension is determined by the addition of right ventricular systolic pressure (RVSP) to central venous pressure (CVP). Initially, a CFD window is placed over the tricuspid valve to visualize tricuspid regurgitation followed by the application of CWD exactly at the point of the regurgitant jet. There will be an envelope below the baseline, which is traced to yield RVSP. The CVP is determined by an assessment of IVC collapsibility. The addition of RVSP and CVP will ultimately determine the calculation of pulmonary artery systolic pressure. This is demonstrated in Video 4. Another very important clinical condition, pulmonary embolism (PE), is a relatively common, life-threatening complication in the perioperative period. Pulmonary embolism is a time-sensitive emergency that requires a rapid diagnosis to ensure adequate intervention and management, and POCUS has been shown to have high specificity in the setting of massive PE. As the RV pressure surpasses that of the LV, the ventricular pressure gradient causes systolic movement of the interventricular septum from the RV to the LV during systole. Therefore, the typical “doughnut” shape of the LV changes into a “D-shape” (Video 5). This D-shaped septal shift is nearly pathognomonic for acute massive PE, and it should be high on the differential diagnosis of any patient in the perioperative setting, who has recently had surgery or has been immobile because of trauma. A massive PE will cause the RV to appear greater in size than the LV on an apical four-chamber or subcostal four-chamber view. In addition, increased RV pressure will enlarge the RA.6 McConnell’s sign is a distinct echocardiographic finding described in patients with acute PE. There is a distinct regional pattern of right ventricular dysfunction with akinesia of the mid free wall but normal motion at the apex.
Video 4
Video 5
Cardiac Output Measurement
Another important utility of advanced FATE is the measurement of cardiac output. A combination of 2D imaging and Doppler ultrasound has the potential to provide a rough measure of cardiac output. Initially a PLAX view is obtained, and LVOT diameter is measured in mid systole approximately 1 cm proximal to AV. This yields the LVOT area. Then an apical five-chamber view is obtained, and CFD is placed specifically at the LVOT followed by application of PWD again at 1 cm from AV. This yields LVOT VTI. The product of LVOT area and LVOT VTI is the stroke volume, which is ultimately multiplied by heart rate to give cardiac output. The steps for this measurement are demonstrated in Video 6. In a recent study, the normal values for LVOT VTI across various races and age groups was 20.2 ± 3.6cm.8 The accuracy of echocardiographic measurement is debatable, but trends are considered generally reliable. The Doppler method is based on the assumption that the LVOT is circular. However, the LVOT is actually more elliptical. The Doppler method assumes that flow at the LVOT is laminar. A change > 12% in LVOT VTI with passive leg raising is considered significant and indicates fluid responsiveness.
Video 6
Conclusions
There is an ever-increasing complexity of surgical patients. As many anaesthesiologists are becoming more familiar with Basic FATE, the obvious next step is learning Advanced FATE views and expanding the role of POCUS in clinical practice. Advanced FATE should always be used in conjunction with an appropriate history and physical examination. The goal of FATE is to simplify its utility as a diagnostic tool by enabling clinicians to determine with confidence whether pathology is present .
References
- Bronshteyn YS, Anderson TA, Badakhsh O, et al. Diagnostic point-of-care ultrasound: recommendations from an expert panel. J Cardiothorac Vasc Anesth 2022;36:22-9. https://doi.org/10.1053/j.jvca.2021.04.016
- Neskovic AN, Skinner H, Price S, et al. Focus cardiac ultrasound core curriculum and core syllabus of the European Association of Cardiovascular Imaging. EHJ- CV Imaging 2018;19:475-81. https://doi.org/10.1093/ehjci/jey006
- Jones M, Elrifay A, Amer N, et al. Con: limitations of POCUS examination: be aware of overdiagnosis and undertreatment. J Cardiothorac Vasc Anesth 2023;S1053-0770(23)00004-6. https://doi.org/10.1053/j.jvca.2023.01.002
- Subramaniam K, Subramanian H, Knight J, et al. J Cardiothorac Vasc Anesth 2022;36:367-86. https://doi.org/10.1053/j.jvca.2021.08.100.
- Sjaus A, Kalagara H. POCUS spotlight: focused cardiac ultrasonography. ASRA Pain Medicine News 2021;46. https://doi.org/10.52211/asra080121.047
- Haskins SC, Tanaka CY, Boublik J, et al. Focused cardiac ultrasound for the regional anesthesiologist and pain specialist. Reg Anesth Pain Med 2017;42(5):632-44. https://doi.org/10.1097/AAP.0000000000000650
- Price LC, Martinez G, Brame A, et al. Perioperative management of patients with pulmonary hypertension undergoing non-cardiothoracic, non-obstetric surgery: a systematic review and expert consensus statement. British J of Anaesthesia 2021;126(4):774-90. https://doi.org/10.1016/j.bja.2021.01.005
- Patel HN, Miyoshi T, Addetia K, et al. Normal values of cardiac output and stroke volume according to measurement technique, age, sex, and ethnicity: results of the World Alliance of Societies of Echocardiography Study. Am Soc Echocardiogr 2021;34(10):1077-85.e1. https://doi.org/1016/j.echo.2021.05.012