POCUS Spotlight: Venous Excess Ultrasound Score (VExUS)
Cite as: Argaiz E, Miralles F, Koratala A. POCUS spotlight: venous excess ultrasound score (VExUS). ASRA Pain Medicine News 2023;48. https://doi.org/10.52211/asra080123.010.
Introduction
The use of POCUS for hemodynamic monitoring has become routine in perioperative care. Traditionally, this evaluation has primarily focused on assessing cardiovascular function and fluid responsiveness. While the mean arterial pressure and forward flow are important determinants of organ perfusion, other important variables, such as the presence and severity of venous congestion, can provide the missing piece of information in hemodynamic monitoring.1
Systemic Venous Congestion and Its Consequences
Systemic venous congestion occurs in the setting of increased right atrial pressure (RAP), either caused by left or right heart failure, increased pulmonary vascular resistance, or obstructive pathologies. While increased RAP can function as a compensatory mechanism in these scenarios, when excessive, transmission of RAP to peripheral organs can result in congestive organ injury.2 For example, transmission of RAP to encapsulated organs, such as the kidneys, leads to increased interstitial pressure, which in turn results in severe hypoperfusion and cessation of glomerular filtration (ie, intra-capsular tamponade). Similarly, congestion can affect any organ system, leading to adverse consequences, including, but not limited to, congestive hepatopathy, congestive encephalopathy, and cardio-intestinal syndrome with translocation of lipopolysaccharide.3
POCUS Assessment of Venous Congestion
Venous congestion assessment should be performed in two steps: 1. Screening and 2. Grading.
Screening
Screening is traditionally performed by inferior vena cava (IVC) ultrasound measurement. An IVC diameter greater than 20 mm suggests increased RAP. We suggest this evaluation be performed using both the long- and short-axis views of the intrahepatic IVC to avoid the cylinder effect and off-axis collapse. Alternatively, ultrasound of the internal jugular vein can be used to determine RAP with good accuracy.4
Grading
Once venous congestion has been detected, it’s severity can be determined by performing venous doppler to assess the return flow pattern. Even though venous return is clearly pulsatile at the level of the right atrium, normal blood flow in small venules and capillaries displays a constant, non-pulsatile velocity.5 The reason for this is that non-congested veins and venules can accommodate retrograde flow and dampen this pulsatility. As the congestion becomes more severe, increased pulsatility will be observed in small vessels and capillaries (Figure 1). The assessment of congestion can be performed at the hepatic, portal, and intra-renal veins.6 While assessing venous flow in the hepatic veins gives us information about the mechanics of right heart filling patterns, the flow patten on portal and intra-renal veins provides information about the degree of pressure transmission to the peripheral organs.
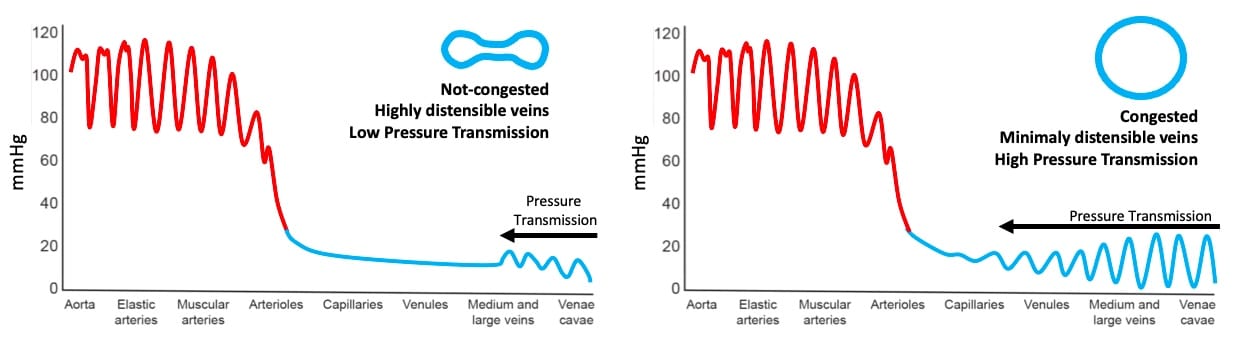
Figure 1. Backwards transmission of pressure from right atrium to peripheral venules and capillaries. Note venous congestion greatly enhances pressure transmission.
Hepatic Vein Doppler
Normal Hepatic Vein (HV) flow is pulsatile. This pulsatility is a direct consequence of its proximity to the right atrium. As such, the central venous pressure (CVP) waveform is easily transmitted to the HV. A normal HV waveform consists of two antegrade (below-the-baseline) waves (S and D) and two retrograde (above-the-baseline) waves (A and V). The S wave is normally larger than the D wave, and they correspond to “x” and “y” descents of the CVP waveform respectively. Pathologies affecting the right heart can result in altered HV waveform independent of the RAP. For example, systolic dysfunction of the RV or moderate tricuspid regurgitation can result in lower S wave amplitude. Severe tricuspid regurgitation causes a reverse S wave, chronic pulmonary hypertension can generate giant A and V waves, and pericardial disease can result in D wave reversals. In the context of elevated RAP, the pressure gradient between the HV and the right atrium reduces, leading to less venous return during systole (S < D pattern). Further, rise in RAP leads to disappearance or reversal of the S wave. Finally, A, S, and V waves may combine to form a single, retrograde wave, leaving the D wave below the baseline (D-only pattern). When feasible, we recommend having a simultaneous EKG trace with the HV waveform to facilitate accurate identification of the individual waves. Figure 2 illustrates how lack of an EKG can lead to potential misinterpretation of the HV Doppler.
When feasible, we recommend having a simultaneous EKG trace with the HV waveform to facilitate accurate identification of the individual waves.
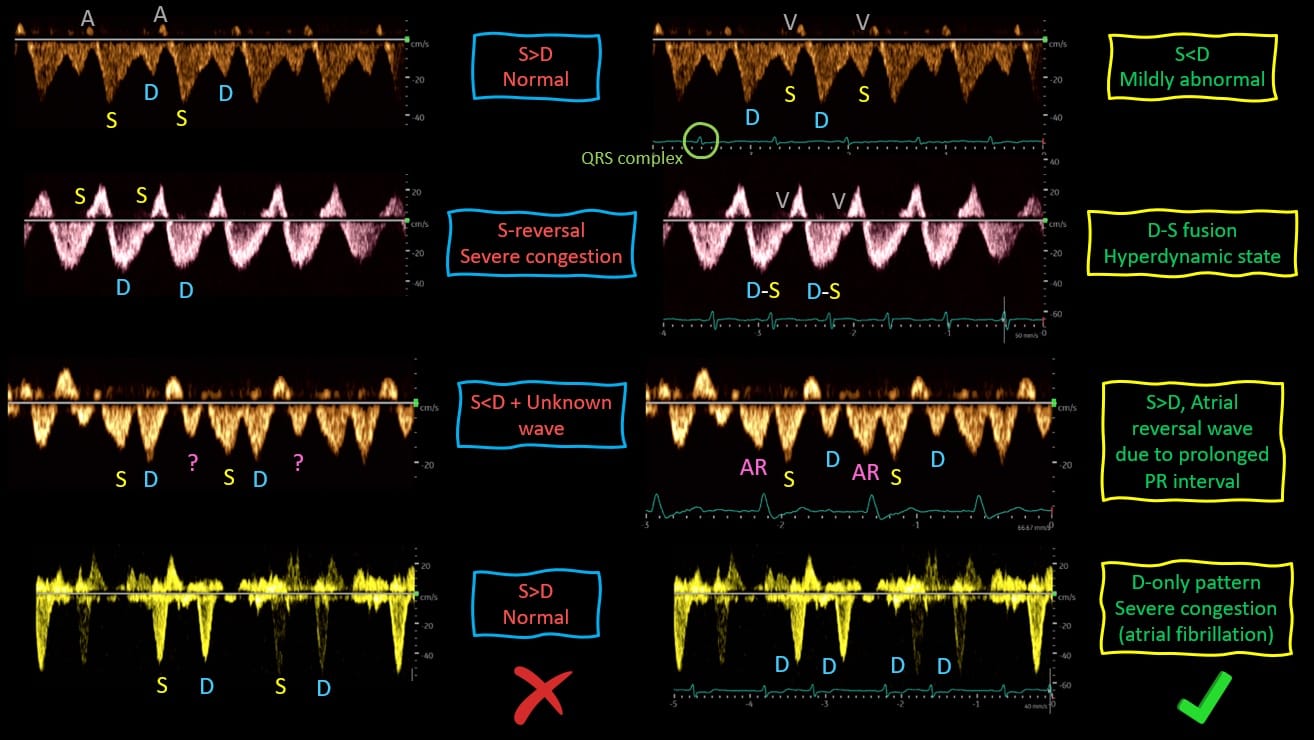
Figure 2. Relevance of simultaneously obtained EKG tracing for the correct interpretation of Hepatic Vein Doppler.
S = systole, D = diastole, AR = atrial reversal
Portal Vein Doppler
Normal portal vein flow is continuous or minimally pulsatile. In the presence of severe venous congestion, RAP can be transmitted backwards across the liver sinusoids, eventually reaching the portal circulation and causing flow to become pulsatile. These alterations can be quantified using the portal vein pulsatility fraction (PVPF): [(Vmax – Vmin)/Vmax] x 100. PVPF > 30% is considered mildly abnormal while PVPF > 50% is considered severely abnormal. Increased PVPF has been clearly shown to be the result of right ventricular failure and increased RAP in post-cardiac surgery patients where it was shown to be the most important predictor of acute kidney injury development.7
Intra-Renal Vein Doppler
Similar to portal vein, normal intra-renal venous flow is continuous or mildly pulsatile. Worsening venous congestion results in a pulsatile flow pattern. These interruptions produce the discontinuous biphasic pattern in moderate congestion (ie, distinct S and D waves) and the discontinuous monophasic pattern (D-only) in severe congestion. Altered intra-renal venous flow is strongly and independently associated with adverse outcomes in patients with heart failure and in patients with pulmonary hypertension.8,9
Figure 3 provides a visual comparison of the normal and severely abnormal waveforms described above. Based on the study by Beaubien-Souligny et al,10 venous congestion is categorized as grades 0-3 depending on the severity of the waveforms. This is commonly referred to as VExUS grading or scoring. Figure 4 provides a summary of how to classify the severity of each of the waveform alterations.
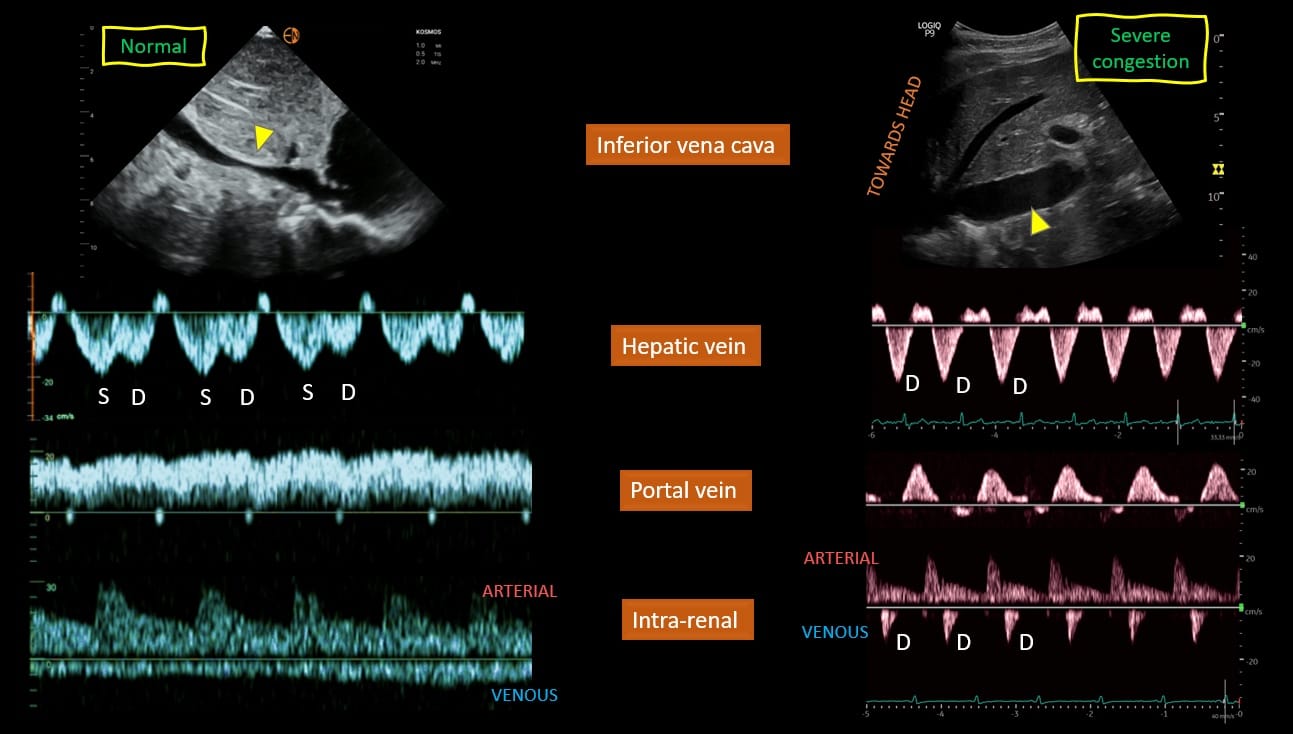
Figure 3. Examples of normal and abnormal venous waveforms.
S = systole, D = diastole
Figure used with permission from Koratala et al, Cardiorenal Medicine. 2022;12(4):141-54.
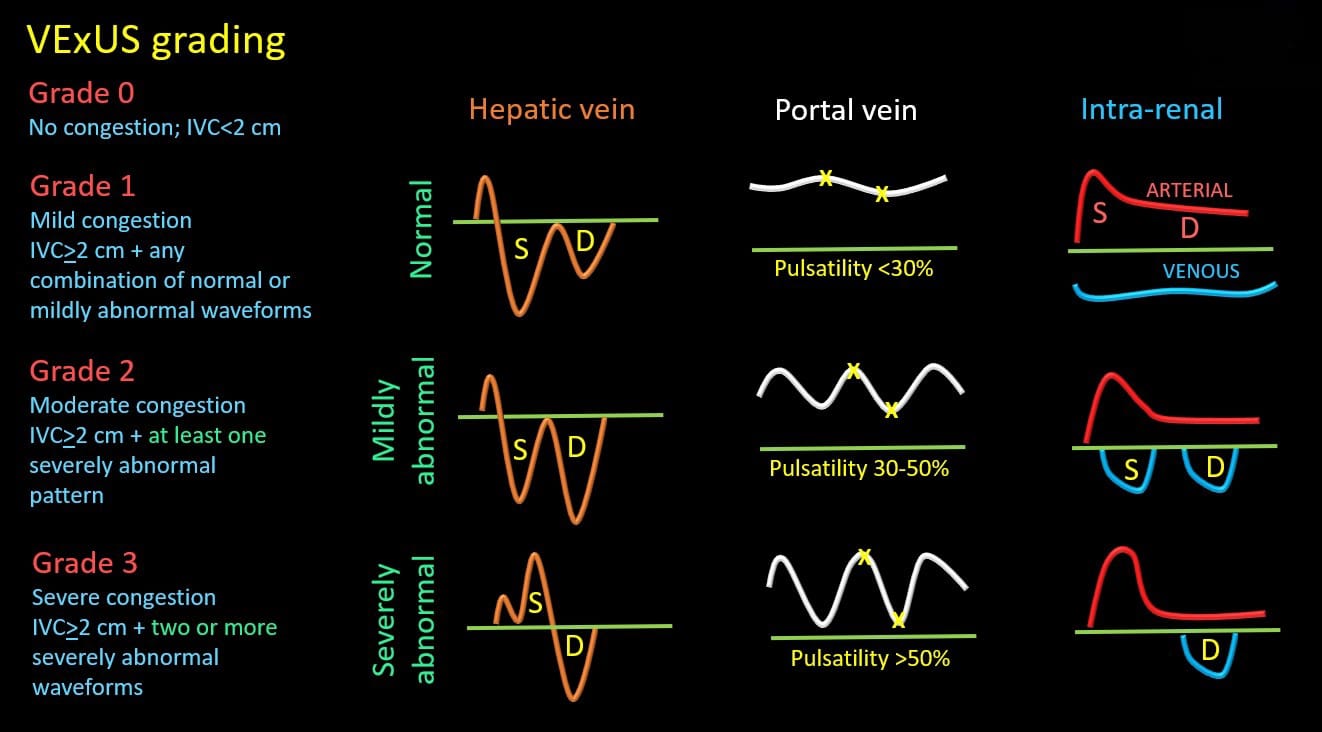
Figure 4. VExUS grading system.
S = systole, D = diastole, IVC = inferior vena cava
Caveats of Venous Doppler
It is important to understand that certain conditions could alter venous waveforms independently of venous congestion. For instance, increased PVPF can be observed in thin, healthy individuals. Figure 5 shows an image of pulsatile PV obtained from a healthy volunteer at an ASRA POCUS workshop. On the other hand, patients with cirrhosis can display a non-pulsatile portal vein even in the presence of severe congestion. Obstructive uropathy and chronic kidney disease can alter intra-renal flow. Evaluation of multiple sites, as in the VExUS grading, offsets some of these limitations and suboptimal waveforms due to technical limitations. It is also noteworthy that venous congestion demonstrated by VExUS score could be present not only in volume overload but also in the presence of pressure overload (eg, pulmonary hypertension) or right heart failure (eg, RV infarction). As such, clinicians must interpret the findings in the appropriate clinical context in conjunction with history, laboratory data, and other sonographic parameters to find the best therapeutic option.
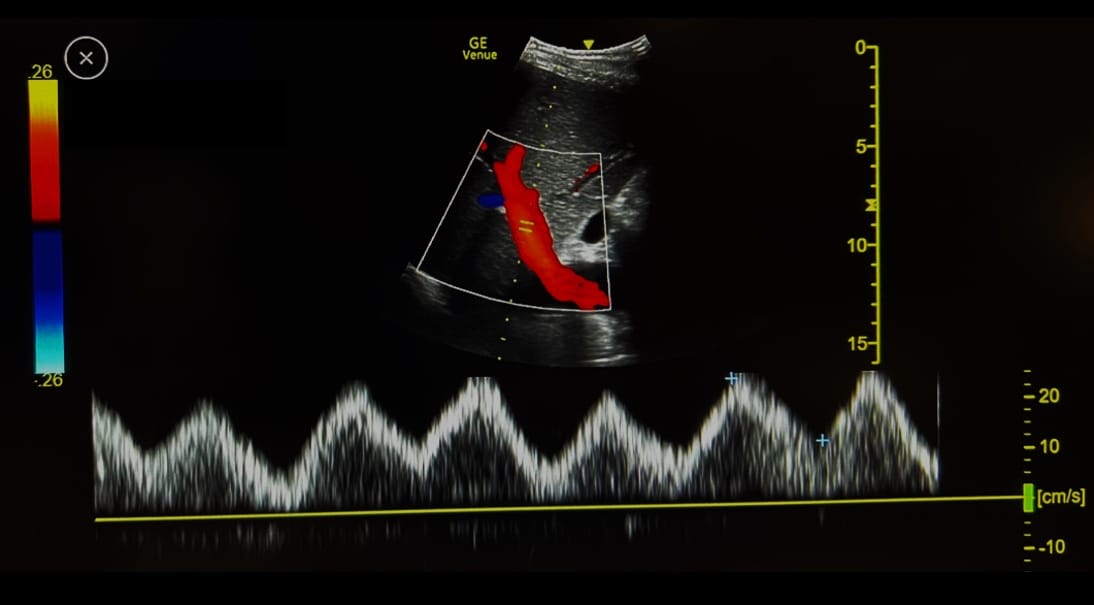
Figure 5. Example of a pulsatile portal vein from a healthy volunteer.
Venous Doppler: How We Do It
The video at the beginning of the article describes the image acquisition technique and common pitfalls.
Clinical Applications of Venous Doppler Ultrasound
Venous Doppler allows the clinician to obtain real time semiquantitative data on the degree of venous congestion. This data can be integrated into the overall hemodynamic assessment to assist in management decisions and monitor changes in real time owing to the dynamic nature of these waveforms.11,12 Figure 6 illustrates a case of congestive heart failure and acute kidney injury where Doppler waveforms showed improvement in response to diuretic therapy. Severely altered venous flow patterns can be thought of as a sign of fluid intolerance where fluid administration can result in worsening organ function.13 Fluids should be avoided in most scenarios with severe venous congestion, and alternative hemodynamic interventions or decongestion should be pursued. As mentioned, it is important to recognize that decongestion does not always equal fluid removal, and the appropriateness of different treatment strategies like inotropes, pulmonary vasodilators, pericardiocentesis, or diuretics/ultrafiltration depends upon the clinical scenario.
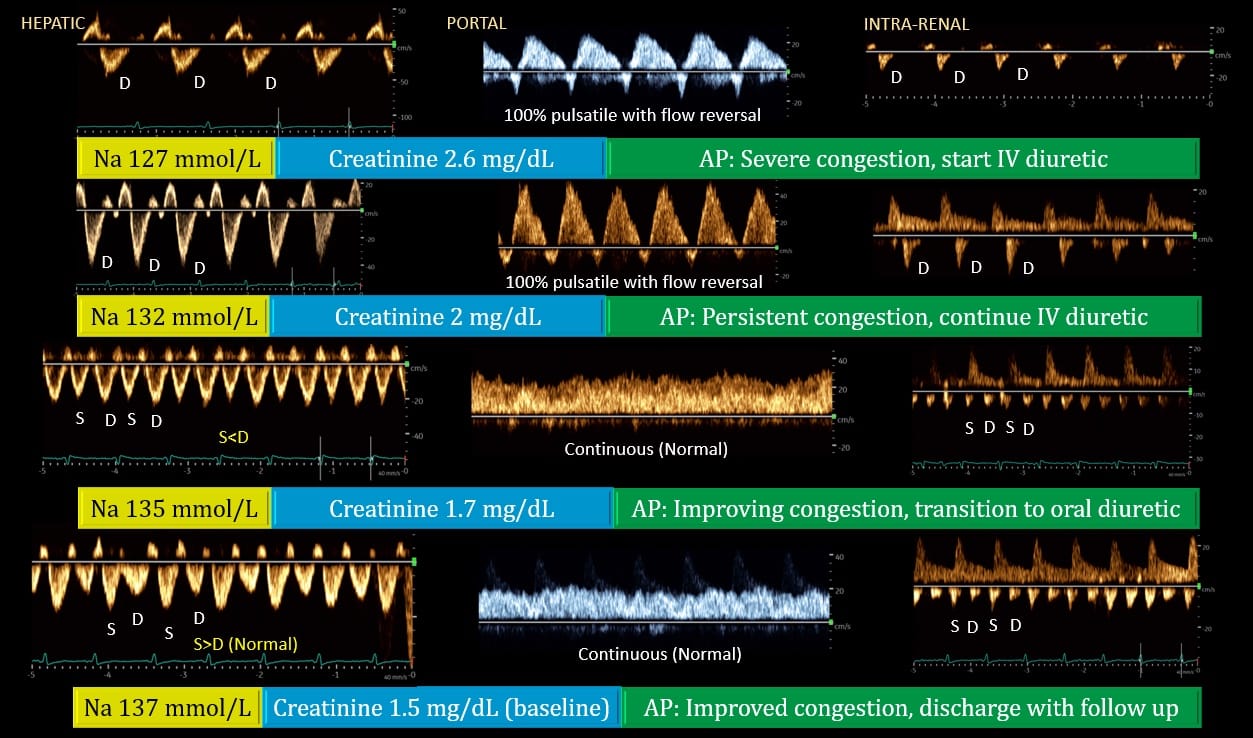
Figure 6. Doppler venous waveforms demonstrating improvement [from top to bottom] in a patient with heart failure, acute kidney injury, and hyponatremia. Generally, improvement in portal vein precedes that of hepatic and renal veins as seen above. Renal interstitial edema may delay the recovery of venous waveform.
S = systole, D = diastole, Na = serum sodium, AP = assessment and plan
Figure used with permission from Dr. Koratala.
Conclusion
Doppler alterations in hepatic, portal, and intra-renal veins reflect transmission of RAP to the peripheral organs and have been clearly associated with adverse clinical outcomes. Identification of these altered waveform patterns should alert the clinician of the possibility of congestive organ injury, which will likely be exacerbated by fluids. Clinical trials aimed at evaluating whether addressing altered abdominal Doppler waveforms will lead to improved clinical outcomes are in progress.

Eduardo R Argaiz, MD, PhD, is an internist and nephrology fellow at Instituto Nacional de Nutrición Salvador Zubirán and a professor at Tecnologico de Monterrey, Escuela de Medicina y Ciencias de la Salud in Mexico.
Francisco Miralles Aguiar, MD, is an anesthesiologist and intensive care specialist at Hospital Universitario Puerta Del Mar in Cádiz, Spain.

Abhilash Koratala, MD, is an associate professor of medicine and director of clinical imaging in the division of nephrology at Medical College of Wisconsin and the founder of NephroPOCUS.com.
References
- Galindo P, Gasca C, Argaiz ER, et al. Point of care venous Doppler ultrasound: exploring the missing piece of bedside hemodynamic assessment. World J Crit Care Med 2021; 10(6):310-22. https://doi.org/5492/wjccm.v10.i6.310
- Rola P, Miralles-Aguiar F, Argaiz E, et al. Clinical applications of the venous excess ultrasound (VExUS) score: conceptual review and case series. Ultrasound J 2021;13(1):32. https://doi.org/10.1186/s13089-021-00232-8
- Argaiz, ER. VExUS nexus: bedside assessment of venous congestion. Adv Chronic Kidney Dis2021;28(3):252–61. https://doi.org/10.1053/j.ackd.2021.03.004
- Istrail L, Kiernan J, Stepanova M. A novel method for estimating right atrial pressure with point-of-care ultrasound. J Am Soc Echocardiogr 2023;36(3):278-83. https://doi.org/10.1016/j.echo.2022.12.008
- Deschamps J et al. Venous Doppler to assess congestion: a comprehensive review of current evidence and nomenclature. Ultrasound Med Biol 2023;49(1):3–17. https://doi.org/10.1016/j.ultrasmedbio.2022.07.011
- Koratala A, Reisinger N. Venous excess Doppler ultrasound for the nephrologist: pearls and pitfalls. Kidney Med 2022 19;4(7):100482. https://doi.org/10.1016/j.xkme.2022.100482
- Beaubien‐Souligny W et al. Alterations in portal vein flow and intrarenal venous flow are associated with acute kidney injury after cardiac surgery: a prospective observational cohort study. J Am Heart Assoc 2018; 7(19):e009961. https://doi.org/10.1161/JAHA.118.009961
- Husain-Syed F et al. Doppler-derived renal venous stasis index in the prognosis of right heart failure. J Am Heart Assoc 2019; 8(21):e013584. https://doi.org/10.1161/JAHA.119.013584
- Iida N et al. Clinical implications of intrarenal hemodynamic evaluation by Doppler ultrasonography in heart failure. JACC Heart Fail 2016; 4(8):674-82. https://doi.org/10.1016/j.jchf.2016.03.016
- Beaubien-Souligny W et al. Quantifying systemic congestion with point-of-care ultrasound: development of the venous excess ultrasound grading system. Ultrasound J 2020;12(1):16. https://doi.org/10.1186/s13089-020-00163-w
- Argaiz ER, Rola P, Gamba G. Dynamic changes in portal vein flow during decongestion in patients with heart failure and cardio-renal syndrome: a POCUS case series. Cardiorenal Med 2021;11(1):59-66. https://doi.org/10.1159/000511714
- Argaiz ER, Cruz N, Gamba G. Evaluation of rapid changes in haemodynamic status by point-of-care ultrasound: a useful tool in cardionephrology. Clin Kidney J 2021;15(2):360-62. https://doi.org/10.1093/ckj/sfab213
- Argaiz ER, Rola P, Haycock KH, et al. Fluid management in acute kidney injury: from evaluating fluid responsiveness towards assessment of fluid tolerance. Eur Heart J Acute Cardiovasc Care2022; 11(10):786-93. https://doi.org/10.1093/ehjacc/zuac104